by Calculated Risk on 3/11/2023 02:11:00 PM
Saturday, March 11, 2023
Real Estate Newsletter Articles this Week: "Pandemic Economics and Housing"
At the Calculated Risk Real Estate Newsletter this week:
• Pandemic Economics, Housing and Monetary Policy: Part I
• Black Knight Mortgage Monitor: Home Prices Declined in January, "on pace to fall below 0% by March/April"
• 1st Look at Local Housing Markets in February
• "Home ATM" is Closing
This is usually published 4 to 6 times a week and provides more in-depth analysis of the housing market.
You can subscribe at https://calculatedrisk.substack.com/
Most content is available for free (and no Ads), but please subscribe!
Schedule for Week of March 12, 2023
by Calculated Risk on 3/11/2023 08:11:00 AM
The key reports this week are February CPI, Retail Sales, and Housing Starts.
For manufacturing, the February Industrial Production report and the March NY and Philly Fed manufacturing surveys will be released.
10:00 AM: State Employment and Unemployment (Monthly) for January 2023
6:00 AM ET: NFIB Small Business Optimism Index for February.
8:30 AM: The Consumer Price Index for February from the BLS. The consensus is for a 0.4% increase in CPI, and a 0.4% increase in core CPI. The consensus is for CPI to be up 6.0% Year-over-year (YoY), and core CPI to be up 5.5% YoY.
7:00 AM ET: The Mortgage Bankers Association (MBA) will release the results for the mortgage purchase applications index.
 8:30 AM: Retail sales for February is scheduled to be released. The consensus is for a 0.3% decrease in retail sales.
This graph shows retail sales since 1992. This is monthly retail sales and food service, seasonally adjusted (total and ex-gasoline). Retail sales ex-gasoline were up 3.2% in January.
8:30 AM: The Producer Price Index for February from the BLS. The consensus is for a 0.3% increase in PPI, and a 0.4% increase in core PPI.
8:30 AM: The New York Fed Empire State manufacturing survey for March. The consensus is for a reading of -7.7, down from -5.8.
10:00 AM: The March NAHB homebuilder survey. The consensus is for a reading of 41, down from 42. Any number below 50 indicates that more builders view sales conditions as poor than good.
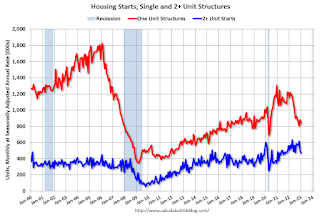 8:30 AM: Housing Starts for February.
 This graph shows single and multi-family housing starts since 1968.
The consensus is for 1.310 million SAAR, up from 1.309 million SAAR.
8:30 AM: The initial weekly unemployment claims report will be released. The consensus is for 205 thousand initial claims, down from 211 thousand last week.
8:30 AM: the Philly Fed manufacturing survey for March. The consensus is for a reading of -14.8, up from -24.3.
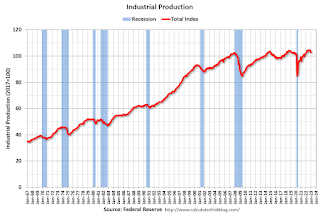 9:15 AM: The Fed will release Industrial Production and Capacity Utilization for February.
This graph shows industrial production since 1967.
The consensus is for a 0.4% increase in Industrial Production, and for Capacity Utilization to increase to 78.5%.
10:00 AM: University of Michigan's Consumer sentiment index (Preliminary for March).
Friday, March 10, 2023
COVID Mar 10, 2023: Update on Cases, Hospitalizations and Deaths
by Calculated Risk on 3/10/2023 09:03:00 PM

| COVID Metrics | ||||
|---|---|---|---|---|
| Now | Week Ago | Goal | ||
| New Cases per Week2 | 170,576 | 226,995 | ≤35,0001 | |
| Hospitalized2 | 18,561 | 21,235 | ≤3,0001 | |
| Deaths per Week2 | 1,862 | 2,265 | ≤3501 | |
| 1my goals to stop weekly posts, 2Weekly for Cases, Currently Hospitalized, and Deaths 🚩 Increasing number weekly for Cases, Hospitalized, and Deaths ✅ Goal met. | ||||
 Click on graph for larger image.
This graph shows the weekly (columns) number of deaths reported.
Hotels: Occupancy Rate Down 5.6% Compared to Same Week in 2019
by Calculated Risk on 3/10/2023 04:11:00 PM
U.S. hotel performance fell from the previous week, according to STR‘s latest data through March 4.The following graph shows the seasonal pattern for the hotel occupancy rate using the four-week average.
Feb. 26 through March 4, 2023 (percentage change from comparable weeks in 2022, 2019):
• Occupancy: 62.8% (+3.0%, -5.6%)
• verage daily rate (ADR): $151.35 (+8.9%, +14.1%)
• Revenue per available room (RevPAR): $95.06 (+12.1%, +7.7%)
*Due to the pandemic impact, STR is measuring recovery against comparable time periods from 2019. Year-over-year comparisons will once again become standard after Q1.
emphasis added
 Click on graph for larger image.
The red line is for 2023, black is 2020, blue is the median, and dashed light blue is for 2022. Dashed purple is 2019 (STR is comparing to a strong year for hotels).
Q1 GDP Tracking
by Calculated Risk on 3/10/2023 03:42:00 PM
From BofA:
The trade deficit in January widened to $68.3bn, the widest deficit in the last three months. Exports increased by 3.4% m/m while imports went up by 3.0%. This increased our tracking estimate for bothexports and imports, while reducing our estimate fornet exports in 1Q. On net, since the last weekly publication, this pushed down our 1Q US GDP tracking estimate from 0.9% q/q saar to 0.7% q/q saar. [Mar 10th estimate]From Goldman:
emphasis added
We left our Q1 GDP tracking estimate unchanged at +2.0% (qoq ar). We also left our domestic final sales forecast unchanged at +2.3%. [Mar 8th estimate]And from the Altanta Fed: GDPNow
The GDPNow model estimate for real GDP growth (seasonally adjusted annual rate) in the first quarter of 2023 is 2.6 percent on March 8, up from 2.0 percent on March 7. [Mar 8th estimate]
Bank Failure #1 in 2023: Silicon Valley Bank
by Calculated Risk on 3/10/2023 12:25:00 PM
Silicon Valley Bank, Santa Clara, California, was closed today by the California Department of Financial Protection and Innovation, which appointed the Federal Deposit Insurance Corporation (FDIC) as receiver. To protect insured depositors, the FDIC created the Deposit Insurance National Bank of Santa Clara (DINB). At the time of closing, the FDIC as receiver immediately transferred to the DINB all insured deposits of Silicon Valley Bank. ... As of December 31, 2022, Silicon Valley Bank had approximately $209.0 billion in total assets and about $175.4 billion in total deposits. At the time of closing, the amount of deposits in excess of the insurance limits was undetermined. The amount of uninsured deposits will be determined once the FDIC obtains additional information from the bank and customers.As of the December 2022, Silicon Valley Bank was the 16th largest US bank in terms of assets.
Comments on February Employment Report
by Calculated Risk on 3/10/2023 09:21:00 AM
The headline jobs number in the February employment report was above expectations, however employment for the previous two months was revised down by 34,000, combined. The participation rate increased, and the unemployment rate increased to 3.6%.
In February, the year-over-year employment change was 4.34 million jobs.
Prime (25 to 54 Years Old) Participation
 Since the overall participation rate is impacted by both cyclical (recession) and demographic (aging population, younger people staying in school) reasons, here is the employment-population ratio for the key working age group: 25 to 54 years old.
The 25 to 54 participation rate increased in February to 83.1% from 82.7% in January, and the 25 to 54 employment population ratio increased to 80.5% from 80.2% the previous month.
Average Hourly Wages
 The graph shows the nominal year-over-year change in "Average Hourly Earnings" for all private employees from the Current Employment Statistics (CES).
 Wage growth has trended down after peaking at 5.9% YoY in March 2022 and was at 4.6% YoY in February.
Part Time for Economic Reasons
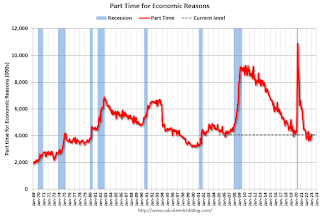 From the BLS report:
"The number of persons employed part time for economic reasons, at 4.1 million, was essentially unchanged in February. These individuals, who would have preferred full-time employment, were working part time because their hours had been reduced or they were unable to find full-time jobs."The number of persons working part time for economic reasons increased in February to 4.067 million from 4.050 million in January. This is at pre-recession levels.
These workers are included in the alternate measure of labor underutilization (U-6) that increased to 6.8% from 6.6% in the previous month. This is down from the record high in April 22.9% and up from the lowest level on record (seasonally adjusted) in December 2022 (6.5%). (This series started in 1994). This measure is below the level in February 2020 (pre-pandemic).
Unemployed over 26 Weeks
 This graph shows the number of workers unemployed for 27 weeks or more.
 According to the BLS, there are 1.057 million workers who have been unemployed for more than 26 weeks and still want a job, down from 1.111 million the previous month.
This is at pre-pandemic levels.
Summary:
The headline monthly jobs number was above expectations; however, employment for the previous two months was revised down by 34,000, combined. The headline unemployment rate increased to 3.6%.
February Employment Report: 311 thousand Jobs, 3.6% Unemployment Rate
by Calculated Risk on 3/10/2023 08:42:00 AM
From the BLS:
Total nonfarm payroll employment rose by 311,000 in February, and the unemployment rate edged up to 3.6 percent, the U.S. Bureau of Labor Statistics reported today. Notable job gains occurred in leisure and hospitality, retail trade, government, and health care. Employment declined in information and in transportation and warehousing.
...
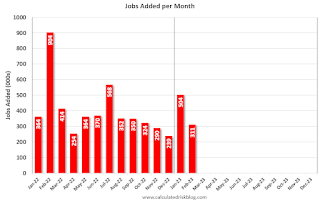
The change in total nonfarm payroll employment for December was revised down by 21,000, from +260,000 to +239,000, and the change for January was revised down by 13,000, from +517,000 to +504,000. With these revisions, employment gains in December and January combined were 34,000 lower than previously reported.
emphasis added
 Click on graph for larger image.
The first graph shows the jobs added per month since January 2022.
Payrolls for December and January were revised down 34 thousand, combined.
 The second graph shows the year-over-year change in total non-farm employment since 1968.
In February, the year-over-year change was 4.34 million jobs. Employment was up significantly year-over-year.
The third graph shows the employment population ratio and the participation rate.
 The Labor Force Participation Rate increased to 62.5% in February, from 62.4% in January. This is the percentage of the working age population in the labor force.
 The Employment-Population ratio was unchanged at 60.2% (blue line).
I'll post the 25 to 54 age group employment-population ratio graph later.
 The fourth graph shows the unemployment rate.
 The unemployment rate increased in February to 3.6% from 3.4% in January.
This was above consensus expectations; however, December and January payrolls were revised down by 34,000 combined.
Thursday, March 09, 2023
Friday: Employment Report
by Calculated Risk on 3/09/2023 09:01:00 PM
Friday:
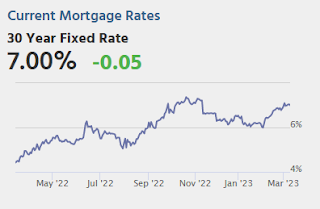
• At 8:30 AM ET, Employment Report for February. The consensus is for 200,000 jobs added, and for the unemployment rate to be unchanged at 3.4%.
"Home ATM" is Closing; Mortgage Equity Withdrawal (MEW) Declines in Q4
by Calculated Risk on 3/09/2023 02:29:00 PM
Today, in the Real Estate Newsletter: "Home ATM" is Closing
Excerpt:
Here is the quarterly increase in mortgage debt from the Federal Reserve’s Financial Accounts of the United States - Z.1 (sometimes called the Flow of Funds report) released today. In the mid ‘00s, there was a large increase in mortgage debt associated with the housing bubble.There is much more in the article. You can subscribe at https://calculatedrisk.substack.com/ (All ad free).
In Q4 2022, mortgage debt increased $155 billion, down from $210 billion in Q3, and down from the cycle peak of $258 billion in Q2 2022. Note the almost 7 years of declining mortgage debt as distressed sales (foreclosures and short sales) wiped out a significant amount of debt.
However, some of this debt is being used to increase the housing stock (purchase new homes), so this isn’t all Mortgage Equity Withdrawal (MEW).
...
The bottom line is, the “Home ATM” is now closing with refinance activity off sharply and HELOC borrowing declining.


