 RSS Feed
 by Calculated Risk on 3/17/2023 09:21:00 AM
Friday, March 17, 2023
Industrial Production Unchanged in February
From the Fed: Industrial Production and Capacity Utilization
Industrial production was unchanged in February, and manufacturing output edged up 0.1 percent. The index for mining fell 0.6 percent, while the index for utilities rose 0.5 percent. At 102.6 percent of its 2017 average, total industrial production in February was 0.2 percent below its year-earlier level. Capacity utilization was unchanged in February at 78.0 percent, a rate that is 1.6 percentage points below its long-run (1972–2022) average.
emphasis added
 Click on graph for larger image.
This graph shows Capacity Utilization. This series is up from the record low set in April 2020, and above the level in February 2020 (pre-pandemic).
Capacity utilization at 78.0% is 1.6% below the average from 1972 to 2021. This was below consensus expectations.
Note: y-axis doesn't start at zero to better show the change.
 The second graph shows industrial production since 1967.
Industrial production was unchanged in February at 102.6. This is above the pre-pandemic level.
Industrial production was below consensus expectations and previous months were revised down.
Thursday, March 16, 2023
Friday: Industrial Production
by Calculated Risk on 3/16/2023 09:01:00 PM
 Note: Mortgage rates are from MortgageNewsDaily.com and are for top tier scenarios.
Friday:
• At 9:15 AM ET, The Fed will release Industrial Production and Capacity Utilization for February. The consensus is for a 0.4% increase in Industrial Production, and for Capacity Utilization to increase to 78.5%.
• At 10:00 AM, University of Michigan's Consumer sentiment index (Preliminary for March).
Realtor.com Reports Weekly Active Inventory Up 61% YoY; New Listings Down 16% YoY
by Calculated Risk on 3/16/2023 02:59:00 PM
Realtor.com has monthly and weekly data on the existing home market. Here is their weekly report released today from Chief economist Danielle Hale: Weekly Housing Trends View — Data Week Ending Mar 11, 2023
• Active inventory growth continued to climb with for-sale homes up 61% above one year ago. Inventories of for-sale homes rose, tying last week’s gain, which was the lowest we’ve seen since December. Instead of new sellers driving these increases, longer time on market is pushing the number of homes for sale higher. Of note, active listings at this time last year were at or near long-term lows.
...
• New listings–a measure of sellers putting homes up for sale–were again down, this week by 18% from one year ago. For 36 weeks, fewer homeowners put their homes on the market for sale than at this time one year ago. This week’s gap was smaller than last week’s, but the lack of new sellers is still a drag on home sales.
 Here is a graph of the year-over-year change in inventory according to realtor.com.
 Inventory is still up sharply year-over-year; however, the YoY increase has slowed recently.
Hotels: Occupancy Rate Down 7.5% Compared to Same Week in 2019
by Calculated Risk on 3/16/2023 02:07:00 PM
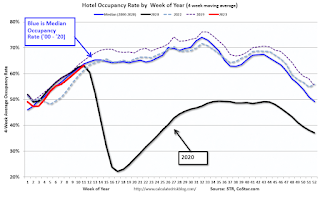
Helped by the onset of spring break travel, U.S. hotel performance increased from the previous week, according to STR‘s latest data through March 11.The following graph shows the seasonal pattern for the hotel occupancy rate using the four-week average.
March 5-11, 2023 (percentage change from comparable weeks in 2022, 2019):
• Occupancy: 64.7% (+2.8%, -7.5%)
• Average daily rate (ADR): $158.20 (+8.1%, +16.6%)
• Revenue per available room (RevPAR): $102.38 (+11.1%, +7.8%)
emphasis added
NOTE: Last year, the occupancy rate was close to normal after the first quarter (depressed due to a surge in COVID), so STR will only be comparing to 2022 after Q1.
 Click on graph for larger image.
The red line is for 2023, black is 2020, blue is the median, and dashed light blue is for 2022. Dashed purple is 2019 (STR is comparing to a strong year for hotels).
 Click on graph for larger image.
The red line is for 2023, black is 2020, blue is the median, and dashed light blue is for 2022. Dashed purple is 2019 (STR is comparing to a strong year for hotels).
The 4-week average of the occupancy rate is close to the median rate for the previous 20 years (Blue).
Note: Y-axis doesn't start at zero to better show the seasonal change.
The 4-week average of the occupancy rate will increase seasonally for a couple more weeks and then move more sideways until the Summer.
February Housing Starts: Average Length of Time from Start to Completion increased Sharply in 2022
by Calculated Risk on 3/16/2023 09:32:00 AM
Today, in the CalculatedRisk Real Estate Newsletter: February Housing Starts: Average Length of Time from Start to Completion increased Sharply in 2022
Excerpt:
Census released the annual data on the length of time from start to completion, and this showed construction delays in 2022.There is much more in the post. You can subscribe at https://calculatedrisk.substack.com/
In 2022, it took an average of 8.3 months from start to completion for single family homes, up from already elevated 7.2 months in 2021. For 2+ unit buildings, it took 17.0 months for buildings with 2 or more units in 2022, up from 15.4 months in 2021. This will be even longer for multi-family in 2023 as many of these units that have been under construction are completed this year.
The delays following the housing bubble were due to many projects being mothballed for several years. The recent delays were due to pandemic related supply constraints.
From Authorization to Start, it took 1.3 months in 2022 for single family homes, up from 1.3 months in 2021, and it took 2.8 months in 2021 for 2+ Unit buildings, up from 2.2 months.
...
The weakness in 2022 was mostly for single family starts. I expect multi-family starts to turn down in 2023.

Housing Starts Increased to 1.450 million Annual Rate in February
by Calculated Risk on 3/16/2023 08:40:00 AM
From the Census Bureau: Permits, Starts and Completions
Housing Starts:
Privately‐owned housing starts in February were at a seasonally adjusted annual rate of 1,450,000. This is 9.8 percent above the revised January estimate of 1,321,000, but is 18.4 percent below the February 2022 rate of 1,777,000. Single‐family housing starts in February were at a rate of 830,000; this is 1.1 percent above the revised January figure of 821,000. The February rate for units in buildings with five units or more was 608,000.
Building Permits:
Privately‐owned housing units authorized by building permits in February were at a seasonally adjusted annual rate of 1,524,000. This is 13.8 percent above the revised January rate of 1,339,000, but is 17.9 percent below the February 2022 rate of 1,857,000. Single‐family authorizations in February were at a rate of 777,000; this is 7.6 percent above the revised January figure of 722,000. Authorizations of units in buildings with five units or more were at a rate of 700,000 in February.
emphasis added
 Click on graph for larger image.
The first graph shows single and multi-family housing starts for the last several years.
Multi-family starts (blue, 2+ units) decreased in February compared to January. Multi-family starts were up 9.9% year-over-year in February.
Single-family starts (red) increased slightly in February and were down 31.6% year-over-year.
 The second graph shows single and multi-family housing starts since 1968.
 This shows the huge collapse following the housing bubble, and then the eventual recovery - and the recent collapse in single-family starts.
Total housing starts in February were above expectations, however, starts in December and January were revised down, combined.
I'll have more later …
Weekly Initial Unemployment Claims decrease to 192,000
by Calculated Risk on 3/16/2023 08:33:00 AM
The DOL reported:
In the week ending March 11, the advance figure for seasonally adjusted initial claims was 192,000, a decrease of 20,000 from the previous week's revised level. The previous week's level was revised up by 1,000 from 211,000 to 212,000. The 4-week moving average was 196,500, a decrease of 750 from the previous week's revised average. The previous week's average was revised up by 250 from 197,000 to 197,250.The following graph shows the 4-week moving average of weekly claims since 1971.
emphasis added
 Click on graph for larger image.
The dashed line on the graph is the current 4-week average. The four-week average of weekly unemployment claims decreased to 196,500.
The previous week was revised up.
Weekly claims were below the consensus forecast.
Wednesday, March 15, 2023
Thursday: Housing Starts, Unemployment Claims, Philly Fed Mfg
by Calculated Risk on 3/15/2023 08:37:00 PM
 Note: Mortgage rates are from MortgageNewsDaily.com and are for top tier scenarios.
Thursday:
• At 8:30 AM ET, Housing Starts for February. The consensus is for 1.310 million SAAR, up from 1.309 million SAAR.
• Also at 8:30 AM, The initial weekly unemployment claims report will be released. The consensus is for 205 thousand initial claims, down from 211 thousand last week.
• Also at 8:30 AM, the Philly Fed manufacturing survey for March. The consensus is for a reading of -14.8, up from -24.3.
Weather Boosted Employment by About 65,000 in February
by Calculated Risk on 3/15/2023 03:13:00 PM
The BLS reported 311 thousand non-farm jobs were added in February. During the Winter months, I like to look at the weather impact on the report.
The BLS reported 174 thousand people were employed in non-agriculture industries, with a job, but not at work due to bad weather. The average for February over the previous 10 years was 345 thousand (median 248 thousand), so fewer than normal impacted by bad weather.
The BLS also reported 493 thousand people that are usually full-time employees were working part time in January due to bad weather. The average for February over the previous 10 years was 1.57 million (median was 708 thousand). This series suggests weather positively impacted employment more than usual (boosting seasonally adjusted employment).
The San Francisco Fed estimates Weather-Adjusted Change in Total Nonfarm Employment (monthly change, seasonally adjusted). They use local area weather to estimate the impact on employment. For February, the San Francisco Fed estimated that weather boosted employment by 65 to 95 thousand jobs.
This is the second consecutive month with an employment boost from better than normal weather, and we should expect some negative payback in coming months.
Current State of the Housing Market: Overview for mid-March
by Calculated Risk on 3/15/2023 12:14:00 PM
Today, in the Calculated Risk Real Estate Newsletter: Current State of the Housing Market; Overview for mid-March
A brief excerpt:
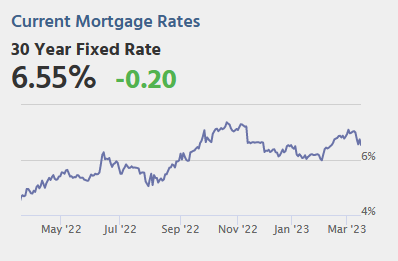
The following graph from MortgageNewsDaily.com shows mortgage rates since January 1, 2020. 30-year mortgage rates were at 6.75% on March 14th, up from 6.0% in early February, and down from the recent high of over 7.0% - and still up sharply year-over-year.There is much more in the article. You can subscribe at https://calculatedrisk.substack.com/
A year ago, the payment on a $500,000 house, with a 20% down payment and 3.76% 30-year mortgage rates, would be around $1,855 for principal and interest. The monthly payment for the same house, with house prices up 3% YoY and mortgage rates at 6.75%, would be $2,672 - an increase of 44%! Monthly payments are still up sharply year-over-year.
There are always some people that need to sell; death, divorce, moving for employment are a few reasons. However, homeowners with a low mortgage rate will be reluctant to sell, and then buy a new home, when their monthly payment will be much higher for the new home. The sharp increase in mortgage rates is probably the key reason new listings have declined sharply year-over-year.
This is very different from the housing bust, when many homeowners were forced to sell as their teaser rates expired and they could not afford the fully amortized mortgage payment. The current situation is similar to the 1980 period, when rates increased quickly.


