by Calculated Risk on 3/20/2023 08:40:00 AM
Monday, March 20, 2023
Goldman Expects the FOMC to Pause
Yesterday I wrote: FOMC Preview: Uncertainty, Likely 25bp Hike, Maybe Pause
This morning Goldman Sachs economist David Mericle wrote: March FOMC Preview: Pause
We expect the FOMC to pause at its March meeting this week because of stress in the banking system. ... This would mean taking a pause in the inflation fight, but that should not be such a problem. ...The inflation problem actually looks less urgent now than last summer because near-term inflation expectations have fallen sharply and long-term inflation expectations have remained anchored.
...
The economic projections will likely show somewhat higher GDP growth in 2023, a lower unemployment rate in 2023, and small upward revisions to the inflation numbers. ... We have left our Fed forecast unchanged beyond March and continue to expect three additional 25bp rate hikes in May, June, and July, which would raise the funds rate to a peak of 5.25-5.5%.
emphasis added
Housing March 20th Weekly Update: Inventory Increased 0.4% Week-over-week
by Calculated Risk on 3/20/2023 08:30:00 AM
 Click on graph for larger image.
This inventory graph is courtesy of Altos Research.

Mike Simonsen discusses this data regularly on Youtube.
Sunday Night Futures
by Calculated Risk on 3/20/2023 12:32:00 AM
Weekend:
• Schedule for Week of March 19, 2023
Monday:
• No major economic releases scheduled.
From CNBC: Pre-Market Data and Bloomberg futures S&P 500 futures and DOW futures are unchanged (fair value).
Oil prices were down over the last week with WTI futures at $66.37 per barrel and Brent at $72.57 per barrel. A year ago, WTI was at $105, and Brent was at $114 - so WTI oil prices are DOWN 37% year-over-year.
Here is a graph from Gasbuddy.com for nationwide gasoline prices. Nationally prices are at $3.40 per gallon. A year ago, prices were at $4.23 per gallon, so gasoline prices are down $0.83 per gallon year-over-year.
Sunday, March 19, 2023
FOMC Preview: Uncertainty, Likely 25bp Hike, Maybe Pause
by Calculated Risk on 3/19/2023 11:48:00 AM
There is uncertainty regarding FOMC policy this month due to the banking issues. Just two weeks ago, the debate appeared to be between a 25bp hike and a 50 bp hike at the March meeting. On March 7th, Fed Chair Powell said:
… the latest economic data have come in stronger than expected, which suggests that the ultimate level of interest rates is likely to be higher than previously anticipated. If the totality of the data were to indicate that faster tightening is warranted, we would be prepared to increase the pace of rate hikes.However, expectations are now that the FOMC will announce a 25bp rate increase in the federal funds rate at the FOMC meeting this week, and they might even pause.
emphasis added
"[W]e look for the Fed to raise its target range for the federal funds rate by 25bp to 4.75-5.0%. The recent market turbulence stemming from distress in several regional banks certainly calls for more caution ... In the absence of further events, policymakers are likely to conclude that inflation stability remains a key monetary policy priority and, given that the economic data point to real side resilience and inflation persistence, a view a 25bp rate hike is warranted. Forward guidance, however, is likely to be somewhat dovish, highlighting the emergence of downside risk to the outlook and the policy rate path."
emphasis added
| GDP projections of Federal Reserve Governors and Reserve Bank presidents, Change in Real GDP1 | ||||
|---|---|---|---|---|
| Projection Date | 2023 | 2024 | 2025 | |
| Dec 2022 | 0.4 to 1.0 | 1.3 to 2.0 | 1.6 to 2.0 | |
The unemployment rate was at 3.6% in February, just above the 50-year low. The FOMC has been criticized for projecting a significant employment recession this year, and they will probably revise down their projected unemployment rate for Q4 2023.
| Unemployment projections of Federal Reserve Governors and Reserve Bank presidents, Unemployment Rate2 | ||||
|---|---|---|---|---|
| Projection Date | 2023 | 2024 | 2025 | |
| Dec 2022 | 4.4 to 4.7 | 4.3 to 4.8 | 4.0 to 4.7 | |
As of January 2023, PCE inflation was up 5.4% year-over-year from January 2022, and, in general, inflation has been close to expectations. However, after accounting for the unusual dynamics related to the pandemic, inflation is likely lower than expected. The FOMC will likely leave their inflation projections mostly unchanged.
| Inflation projections of Federal Reserve Governors and Reserve Bank presidents, PCE Inflation1 | ||||
|---|---|---|---|---|
| Projection Date | 2023 | 2024 | 2025 | |
| Dec 2022 | 2.9 to 3.5 | 2.3 to 2.7 | 2.0 to 2.2 | |
PCE core inflation was up 4.7% in January year-over-year.
| Core Inflation projections of Federal Reserve Governors and Reserve Bank presidents, Core Inflation1 | ||||
|---|---|---|---|---|
| Projection Date | 2023 | 2024 | 2025 | |
| Dec 2022 | 3.2 to 3.7 | 2.3 to 2.7 | 2.0 to 2.2 | |
Saturday, March 18, 2023
Real Estate Newsletter Articles this Week: "Average Length of Time from Start to Completion increased Sharply in 2022"
by Calculated Risk on 3/18/2023 02:11:00 PM
At the Calculated Risk Real Estate Newsletter this week:
• Pandemic Economics, Housing and Monetary Policy: Part 2
• Current State of the Housing Market; Overview for mid-March
• Lawler: Early Read on Existing Home Sales in February
• February Housing Starts: Average Length of Time from Start to Completion increased Sharply in 2022
• Q4 Update: Delinquencies, Foreclosures and REO
• 2nd Look at Local Housing Markets in February
This is usually published 4 to 6 times a week and provides more in-depth analysis of the housing market.
You can subscribe at https://calculatedrisk.substack.com/
Most content is available for free (and no Ads), but please subscribe!
Schedule for Week of March 19, 2023
by Calculated Risk on 3/18/2023 08:11:00 AM
The key reports this week are February New and Existing Home Sales.
The FOMC meets this week, and there is some uncertainty on rate hikes due to the recent banking issues.
No major economic releases scheduled.
 10:00 AM: Existing Home Sales for February from the National Association of Realtors (NAR). The consensus is for 4.15 million SAAR, up from 4.00 million.
The graph shows existing home sales from 1994 through the report last month.
7:00 AM ET: The Mortgage Bankers Association (MBA) will release the results for the mortgage purchase applications index.
During the day: The AIA's Architecture Billings Index for February (a leading indicator for commercial real estate).
2:00 PM: FOMC Meeting Announcement. The FOMC is expected to raise the Fed Funds rate by 25bps at this meeting, although there is some uncertainty due to the bank issues.
2:00 PM: FOMC Projections. This will include the Federal Open Market Committee (FOMC) participants' projections of the appropriate target federal funds rate along with updated economic projections.
2:30 PM: Fed Chair Jerome Powell holds a press briefing following the FOMC announcement.
8:30 AM: The initial weekly unemployment claims report will be released. The consensus is for 190 thousand initial claims, down from 192 thousand last week.
8:30 AM ET: Chicago Fed National Activity Index for February. This is a composite index of other data.
 10:00 AM: New Home Sales for February from the Census Bureau.
 This graph shows New Home Sales since 1963. The dashed line is the sales rate for last month.
The consensus is for 650 thousand SAAR, down from 670 thousand in January.
11:00 AM: the Kansas City Fed manufacturing survey for March.
8:30 AM: Durable Goods Orders for February from the Census Bureau. The consensus is for a 1.2% increase in durable goods orders.
10:00 AM: State Employment and Unemployment (Monthly), February 2023
Friday, March 17, 2023
COVID Mar 17, 2023: Update on Cases, Hospitalizations and Deaths
by Calculated Risk on 3/17/2023 08:45:00 PM

| COVID Metrics | ||||
|---|---|---|---|---|
| Now | Week Ago | Goal | ||
| New Cases per Week2 | 149,955 | 186,793 | ≤35,0001 | |
| Hospitalized2 | 17,348 | 19,629 | ≤3,0001 | |
| Deaths per Week2 | 1,706 | 2,100 | ≤3501 | |
| 1my goals to stop weekly posts, 2Weekly for Cases, Currently Hospitalized, and Deaths 🚩 Increasing number weekly for Cases, Hospitalized, and Deaths ✅ Goal met. | ||||
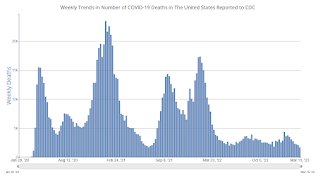
 Click on graph for larger image.
This graph shows the weekly (columns) number of deaths reported.
LA Port Inbound Traffic Down Sharply YoY in February
by Calculated Risk on 3/17/2023 03:16:00 PM
Notes: The expansion to the Panama Canal was completed in 2016 (As I noted several years ago), and some of the traffic that used the ports of Los Angeles and Long Beach is probably going through the canal. This might be impacting TEUs on the West Coast.
Container traffic gives us an idea about the volume of goods being exported and imported - and usually some hints about the trade report since LA area ports handle about 40% of the nation's container port traffic.
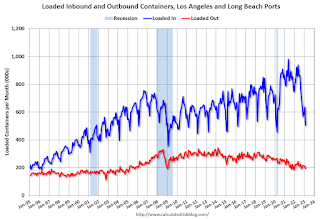
The following graphs are for inbound and outbound traffic at the ports of Los Angeles and Long Beach in TEUs (TEUs: 20-foot equivalent units or 20-foot-long cargo container).
To remove the strong seasonal component for inbound traffic, the first graph shows the rolling 12-month average.

On a rolling 12-month basis, inbound traffic decreased 3.4% in February compared to the rolling 12 months ending in January. Outbound traffic decreased 0.8% compared to the rolling 12 months ending the previous month.
 Usually imports peak in the July to October period as retailers import goods for the Christmas holiday, and then decline sharply and bottom in February or March depending on the timing of the Chinese New Year.
Lawler: Early Read on Existing Home Sales in February
by Calculated Risk on 3/17/2023 01:12:00 PM
Today, in the Calculated Risk Real Estate Newsletter:
Lawler: Early Read on Existing Home Sales in February 3rd Look at Local Housing Markets in February
A brief excerpt:
This is the third look at local markets in February. I’m tracking about 40 local housing markets in the US. Some of the 40 markets are states, and some are metropolitan areas. I’ll update these tables throughout the month as additional data is released.There is much more in the article. You can subscribe at https://calculatedrisk.substack.com/
...
California doesn’t report monthly inventory numbers, but they do report the change in months of inventory. Here is the press release from the California Association of Realtors® (C.A.R.): More favorable interest rates perk up California home sales for third straight month in February, C.A.R. reports• Existing, single-family home sales totaled 284,010 in February on a seasonally adjusted annualized rate, up 17.6 percent from January and down 33.2 percent from February 2022....
• February’s statewide median home price was $735,480, down 2.1 percent from January and down 4.8 percent from February 2022.
In February, sales in these markets were down 23.7%. In January, these same markets were down 34.1% YoY Not Seasonally Adjusted (NSA).
This is a significantly smaller YoY decline NSA than in January for these early reporting markets.
This data suggests NAR reported sales will rebound in February. This will still be a significant YoY decline, and the 18th consecutive month with a YoY decline.
...
More local markets to come!
Q1 GDP Tracking: Wide Range
by Calculated Risk on 3/17/2023 10:33:00 AM
From BofA:
On net, since the last weekly publication, this pushed up our 1Q US GDP tracking estimate from 0.7% q/q saar to 0.9% q/q saar and left 4Q unchanged at 2.9% q/q saar. [Mar 17th estimate]From Goldman:
emphasis added
We left our Q1 GDP tracking estimate unchanged at 2.6% (qoq ar). [Mar 16th estimate]And from the Altanta Fed: GDPNow
The GDPNow model estimate for real GDP growth (seasonally adjusted annual rate) in the first quarter of 2023 is 3.2 percent on March 16, unchanged from March 15 after rounding. After this morning's releases from the US Census Bureau and the US Bureau of Labor Statistics, an increase in the nowcast of first-quarter real net exports was offset by a decrease in the nowcast of first-quarter real residential investment growth. [Mar 16th estimate]


