 RSS Feed
 by Calculated Risk on 3/23/2023 09:04:00 PM
Thursday, March 23, 2023
Friday: Durable Goods
 Note: Mortgage rates are from MortgageNewsDaily.com and are for top tier scenarios.
Friday:
• At 8:30 AM ET, Durable Goods Orders for February from the Census Bureau. The consensus is for a 1.2% increase in durable goods orders.
• At 10:00 AM, State Employment and Unemployment (Monthly), February 2023
Vehicle Sales Forecast: Vehicle Sales to be up Year-over-year in March
by Calculated Risk on 3/23/2023 04:02:00 PM
From WardsAuto: March U.S. Light-Vehicle Sales, Inventory Pegged for Solid Gains; First-Quarter Deliveries to Rise 7% (pay content). Brief excerpt:
Though gradually improving, inventory remains the story behind why sales remain low by historical standards. There are underlying crosscurrents related to the economy, rising interest rates and geopolitics, among others, that are helping stanch demand, but lack of inventory is the main reason growth is not significantly stronger (and even largely why prices are stuck at elevated levels - though that headwind is lessening as inventory rises).
emphasis added
 Click on graph for larger image.
This graph shows actual sales from the BEA (Blue), and Wards forecast for March (Red).
The Wards forecast of 14.4 million SAAR, would be down 3% from last month, and up 6.2% from a year ago.
Vehicle sales are usually a transmission mechanism for Federal Open Market Committee (FOMC) policy, although far behind housing. This time vehicle sales have been more suppressed by supply chain issues but have picked up recently.
More Good News for Homebuilders
by Calculated Risk on 3/23/2023 01:41:00 PM
Today, in the Calculated Risk Real Estate Newsletter: More Good News for Homebuilders
A brief excerpt:
Last October I wrote: Some "Good News" for HomebuildersThere is much more in the article. You can subscribe at https://calculatedrisk.substack.com/
I noted:[T]he good news for the homebuilders is activity usually picks up quickly following an interest rate induced slowdown (as opposed to following the housing bust when the recovery took many years).I included the following graph to illustrate this point. The following graph shows new home sales for three periods: 1978-1982, 2005-2020, and current (red). The prior peak in sales is set to 100 (updated through the February New Home sales release).
...
My sense is this downturn will have some similarities to the 1980 period, see: Housing: Don't Compare the Current Housing Boom to the Bubble and Bust

Black Knight: Mortgage Delinquencies Increased Slightly in February
by Calculated Risk on 3/23/2023 12:33:00 PM
From Black Knight: Black Knight’s First Look at February 2023 Mortgage Data: Prepayments Rebound from All-Time Low; Overall Mortgage Delinquencies Inch Up As 30-Days Late Payments Rise
• The national mortgage delinquency rate increased 7 basis points in February to 3.45%, but remains down 12.6% year over yearAccording to Black Knight's First Look report, the percent of loans delinquent increased 2.0% in February compared to January and decreased 13% year-over-year.
• Prepayment activity (SMM) inched up to 0.35% – breaking a four-month streak of record lows, with relief likely to extend as the spring homebuying season takes hold
• A 36K rise in overall delinquencies was driven by a nearly 65K increase in those just a single payment behind, while 60-day delinquencies fell by nearly 12K (-4.0%) and 90-day delinquencies fell by 17K (-3.0%)
...
• Foreclosure starts decreased by 9% in the month to 29K, breaking a streak of increases, with starts remaining 19% below pre-pandemic levels
...
• Active foreclosure inventory rose marginally (+2K) in the month, and is up 34K (+15%) from February 2022 despite remaining 15% below its pre-pandemic level
• February saw 7.1K foreclosure sales (completions) nationally, up 2.5% from the month prior
emphasis added
Black Knight reported the U.S. mortgage delinquency rate (loans 30 or more days past due, but not in foreclosure) was 3.45% in February, up from 3.38% the previous month.
The percent of loans in the foreclosure process increased slightly in February to 0.46%, from 0.45% the previous month.
The number of delinquent properties, but not in foreclosure, is down 235,000 properties year-over-year, and the number of properties in the foreclosure process is up 34,000 properties year-over-year.
| Black Knight: Percent Loans Delinquent and in Foreclosure Process | ||||
|---|---|---|---|---|
| Feb 2023 | Jan 2023 | |||
| Delinquent | 3.45% | 3.38% | ||
| In Foreclosure | 0.46% | 0.45% | ||
| Number of properties: | ||||
| Number of properties that are delinquent, but not in foreclosure: | 1,811,000 | 1,775,000 | ||
| Number of properties in foreclosure pre-sale inventory: | 240,000 | 238,000 | ||
| Total Properties | 2,050,000 | 2,012,000 | ||
New Home Sales at 640,000 Annual Rate in February; New Home Average Prices Down 4.5% Year-over-year
by Calculated Risk on 3/23/2023 10:42:00 AM
Today, in the Calculated Risk Real Estate Newsletter: New Home Sales at 640,000 Annual Rate in February
Brief excerpt:
And on prices, from the Census Bureau:You can subscribe at https://calculatedrisk.substack.com/.The median sales price of new houses sold in February 2023 was $438,200. The average sales price was $498,700.The following graph shows the median and average new home prices. The average price in February 2023 was $498,700 down 4.5% year-over-year. The median price was $438,200 up 2.5% year-over-year. This suggests a year-over-year decrease in prices, although both the median and the average are impacted by the mix of homes sold.
...
This was for contracts signed in February when mortgage rates were lower - and builders were buying down rates. Mortgage rates increased again at the end of February, and that will likely impact sales in March.
As previously discussed, the Census Bureau overestimates sales, and underestimates inventory when cancellation rates are rising, see: New Home Sales and Cancellations: Net vs Gross Sales. This might be reversing now since cancellation rates have started to decline. When a previously cancelled home is resold, the home builder counts it as a sale, but the Census Bureau does not (since it was already counted).
There are a large number of homes under construction, and this suggests we will see a further increase in completed inventory over the next several months - and that will keep pressure on new home prices.

New Home Sales at 640,000 Annual Rate in February
by Calculated Risk on 3/23/2023 10:06:00 AM
The Census Bureau reports New Home Sales in February were at a seasonally adjusted annual rate (SAAR) of 640 thousand.
The previous three months were revised down.
Sales of new single‐family houses in February 2023 were at a seasonally adjusted annual rate of 640,000, according to estimates released jointly today by the U.S. Census Bureau and the Department of Housing and Urban Development. This is 1.1 percent above the revised January rate of 633,000, but is 19.0 percent below the February 2022 estimate of 790,000.
emphasis added
 Click on graph for larger image.
The first graph shows New Home Sales vs. recessions since 1963. The dashed line is the current sales rate.
New home sales are close to pre-pandemic levels.
The second graph shows New Home Months of Supply.
 The months of supply decreased in February to 8.2 months from 8.3 months in January.
 The all-time record high was 12.2 months of supply in January 2009. The all-time record low was 3.3 months in August 2020.
This is well above the top of the normal range (about 4 to 6 months of supply is normal).
"The seasonally‐adjusted estimate of new houses for sale at the end of February was 436,000. This represents a supply of 8.2 months at the current sales rate."Sales were below expectations of 650 thousand SAAR, and sales in the three previous months were revised down. I'll have more later today.
Weekly Initial Unemployment Claims decrease to 191,000
by Calculated Risk on 3/23/2023 08:33:00 AM
The DOL reported:
In the week ending March 18, the advance figure for seasonally adjusted initial claims was 191,000, a decrease of 1,000 from the previous week's unrevised level of 192,000. The 4-week moving average was 196,250, a decrease of 250 from the previous week's unrevised average of 196,500.The following graph shows the 4-week moving average of weekly claims since 1971.
emphasis added
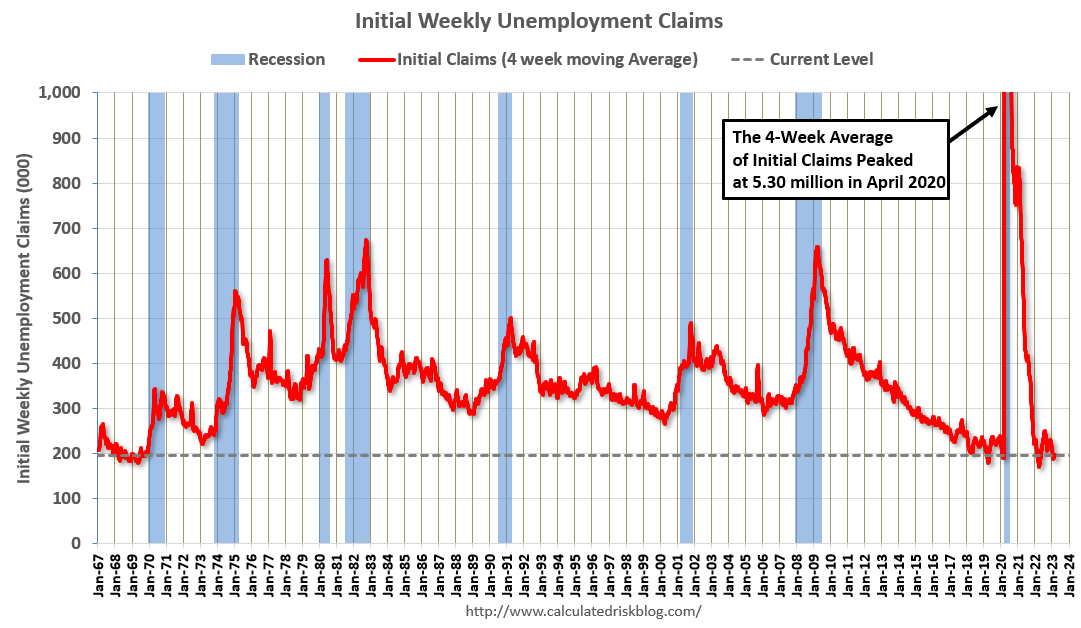 Click on graph for larger image.
The dashed line on the graph is the current 4-week average. The four-week average of weekly unemployment claims decreased to 196,250.
The previous week was unrevised.
Weekly claims were close to the consensus forecast.
Wednesday, March 22, 2023
Thursday: New Home Sales, Unemployment Claims
by Calculated Risk on 3/22/2023 09:05:00 PM
 Note: Mortgage rates are from MortgageNewsDaily.com and are for top tier scenarios.
Thursday:
• At 8:30 AM ET, The initial weekly unemployment claims report will be released. The consensus is for 190 thousand initial claims, down from 192 thousand last week.
• At 8:30 AM, Chicago Fed National Activity Index for February. This is a composite index of other data.
• At 10:00 AM, New Home Sales for February from the Census Bureau. The consensus is for 650 thousand SAAR, down from 670 thousand in January.
• At 11:00 AM, the Kansas City Fed manufacturing survey for March.
FOMC Projections and Press Conference
by Calculated Risk on 3/22/2023 02:09:00 PM
Statement here.
Fed Chair Powell press conference video here or on YouTube here, starting at 2:30 PM ET.
Here are the projections. In December, the FOMC participants’ midpoint of the target level for the federal funds rate was 5.125%. The FOMC participants’ midpoint of the target range is now somewhat above 5.125%.
Current Wall Street GDP tracking estimates show decent growth in Q1 (although there is a wide range of estimates). GDP projections for 2023 were revised down, contrary to recent data.
| GDP projections of Federal Reserve Governors and Reserve Bank presidents, Change in Real GDP1 | ||||
|---|---|---|---|---|
| Projection Date | 2023 | 2024 | 2025 | |
| Mar 2023 | 0.0 to 0.8 | 1.0 to 1.5 | 1.7 to 2.1 | |
| Dec 2022 | 0.4 to 1.0 | 1.3 to 2.0 | 1.6 to 2.0 | |
The unemployment rate was at 3.6% in February, just above the 50-year low. The FOMC revised down slightly their projected unemployment rate for Q4 2023.
| Unemployment projections of Federal Reserve Governors and Reserve Bank presidents, Unemployment Rate2 | ||||
|---|---|---|---|---|
| Projection Date | 2023 | 2024 | 2025 | |
| Mar 2023 | 4.0 to 4.7 | 4.3 to 4.9 | 4.3 to 4.8 | |
| Dec 2022 | 4.4 to 4.7 | 4.3 to 4.8 | 4.0 to 4.7 | |
As of January 2023, PCE inflation was up 5.4% year-over-year from January 2022, and, in general, inflation has been close to expectations. However, after accounting for the unusual dynamics related to the pandemic, inflation is likely lower than expected. The FOMC revised up their PCE inflation projections.
| Inflation projections of Federal Reserve Governors and Reserve Bank presidents, PCE Inflation1 | ||||
|---|---|---|---|---|
| Projection Date | 2023 | 2024 | 2025 | |
| Mar 2023 | 3.0 to 3.8 | 2.2 to 2.8 | 2.0 to 2.2 | |
| Dec 2022 | 2.9 to 3.5 | 2.3 to 2.7 | 2.0 to 2.2 | |
PCE core inflation was up 4.7% in January year-over-year. The FOMC revised up their core PCE projections.
| Core Inflation projections of Federal Reserve Governors and Reserve Bank presidents, Core Inflation1 | ||||
|---|---|---|---|---|
| Projection Date | 2023 | 2024 | 2025 | |
| Mar 2023 | 3.5 to 3.9 | 2.3 to 2.8 | 2.0 to 2.2 | |
| Dec 2022 | 3.2 to 3.7 | 2.3 to 2.7 | 2.0 to 2.2 | |
FOMC Statement: Raise Rates 25 bp; "some additional policy firming may be appropriate"
by Calculated Risk on 3/22/2023 02:02:00 PM
Fed Chair Powell press conference video here or on YouTube here, starting at 2:30 PM ET.
FOMC Statement:
Recent indicators point to modest growth in spending and production. Job gains have picked up in recent months and are running at a robust pace; the unemployment rate has remained low. Inflation remains elevated.
The U.S. banking system is sound and resilient. Recent developments are likely to result in tighter credit conditions for households and businesses and to weigh on economic activity, hiring, and inflation. The extent of these effects is uncertain. The Committee remains highly attentive to inflation risks.
The Committee seeks to achieve maximum employment and inflation at the rate of 2 percent over the longer run. In support of these goals, the Committee decided to raise the target range for the federal funds rate to 4-3/4 to 5 percent. The Committee will closely monitor incoming information and assess the implications for monetary policy. The Committee anticipates that some additional policy firming may be appropriate in order to attain a stance of monetary policy that is sufficiently restrictive to return inflation to 2 percent over time. In determining the extent of future increases in the target range, the Committee will take into account the cumulative tightening of monetary policy, the lags with which monetary policy affects economic activity and inflation, and economic and financial developments. In addition, the Committee will continue reducing its holdings of Treasury securities and agency debt and agency mortgage-backed securities, as described in its previously announced plans. The Committee is strongly committed to returning inflation to its 2 percent objective.
In assessing the appropriate stance of monetary policy, the Committee will continue to monitor the implications of incoming information for the economic outlook. The Committee would be prepared to adjust the stance of monetary policy as appropriate if risks emerge that could impede the attainment of the Committee's goals. The Committee's assessments will take into account a wide range of information, including readings on labor market conditions, inflation pressures and inflation expectations, and financial and international developments.
Voting for the monetary policy action were Jerome H. Powell, Chair; John C. Williams, Vice Chair; Michael S. Barr; Michelle W. Bowman; Lisa D. Cook; Austan D. Goolsbee; Patrick Harker; Philip N. Jefferson; Neel Kashkari; Lorie K. Logan; and Christopher J. Waller.
emphasis added


