by Calculated Risk on 3/29/2023 07:00:00 AM
Wednesday, March 29, 2023
MBA: Mortgage Purchase Applications Increased in Weekly Survey
From the MBA: Mortgage Applications Increase in Latest MBA Weekly Survey
Mortgage applications increased 2.9 percent from one week earlier, according to data from the Mortgage Bankers Association’s (MBA) Weekly Mortgage Applications Survey for the week ending March 24, 2023.
The Market Composite Index, a measure of mortgage loan application volume, increased 2.9 percent on a seasonally adjusted basis from one week earlier. On an unadjusted basis, the Index increased 3 percent compared with the previous week. The Refinance Index increased 5 percent from the previous week and was 61 percent lower than the same week one year ago. The seasonally adjusted Purchase Index increased 2 percent from one week earlier. The unadjusted Purchase Index increased 2 percent compared with the previous week and was 35 percent lower than the same week one year ago.
“Application activity increased as mortgage rates declined for the third straight week. The 30-year fixed rate declined to 6.45 percent, the lowest level in over a month,” said Joel Kan, MBA’s Vice President and Deputy Chief Economist. “While the 30-year fixed rate remained 1.65 percentage points higher than a year ago, homebuyers responded, leading to a fourth straight increase in purchase applications. Home price growth has slowed markedly in many parts of the country, which has helped to improve buyers’ purchasing power. Purchase applications remain over 30 percent behind last year’s pace, but recent increases, along with data from other sources showing an uptick in home sales, is a welcome development.”
Added Kan, “Refinance activity also picked up last week, but remains 61 percent below last year’s pace. Most homeowners still have rates significantly lower than current levels, leaving only a small pool of borrowers with an incentive to refinance.”
..
The average contract interest rate for 30-year fixed-rate mortgages with conforming loan balances ($726,200 or less) decreased to 6.45 percent from 6.48 percent, with points decreasing to 0.62 from 0.66 (including the origination fee) for 80 percent loan-to-value ratio (LTV) loans.
emphasis added
 Click on graph for larger image.
The first graph shows the MBA mortgage purchase index.
According to the MBA, purchase activity is down 35% year-over-year unadjusted.

Tuesday, March 28, 2023
Wednesday: Pending Home Sales
by Calculated Risk on 3/28/2023 08:59:00 PM

Wednesday:
• At 7:00 AM ET, The Mortgage Bankers Association (MBA) will release the results for the mortgage purchase applications index.
• At 10:00 AM, Pending Home Sales Index for February. The consensus is for a 3.0% decrease in the index.
Las Vegas February 2023: Visitor Traffic Down 3.4% Compared to 2019; Convention Traffic Down 11.4%
by Calculated Risk on 3/28/2023 01:58:00 PM
Note: I like using Las Vegas as a measure of recovery for both leisure (visitors) and business (conventions).
From the Las Vegas Visitor Authority: February 2023 Las Vegas Visitor Statistics
With an easy comparison to the lingering COVID‐affected months of last year, Las Vegas saw visitation approach 3.1M in February 2023, up +17.8% over February 2022.
Overall hotel occupancy exceeded 82% for the month, +12.9 pts YoY and down ‐4.8 pts vs. 2019 while Weekend occupancy reached 89.3%, up 1.8 pts YoY and ‐2.6 pts vs. February 2019. Supported by the strengthening convention/group segment, Midweek occupancy reached 78.8%, + 18.1 pts vs. February 2022 and ‐5.8 pts vs. February 2019.
Robust room rates equated to overall ADR of approx. $177, +18.1% ahead of February 2022 and +35.8% vs. February 2019 while RevPAR exceeded $145, +40.1% YoY and +28.3% over February 2019.
 Click on graph for larger image.
 The first graph shows visitor traffic for 2019 (Black), 2020 (light blue), 2021 (purple), 2022 (orange), and 2023 (red).
Visitor traffic was down 3.4% compared to the same month in 2019.
Note: There was almost no convention traffic from April 2020 through May 2021.
Freddie Mac: Mortgage Serious Delinquency Rate declined in February
by Calculated Risk on 3/28/2023 01:01:00 PM
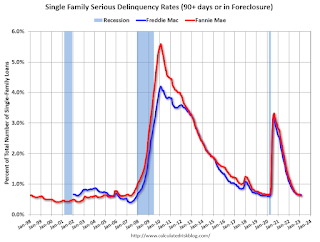
Freddie Mac reported that the Single-Family serious delinquency rate in February was 0.65%, down from 0.66% January. Freddie's rate is down year-over-year from 0.99% in February 2022.
Freddie's serious delinquency rate peaked in February 2010 at 4.20% following the housing bubble and peaked at 3.17% in August 2020 during the pandemic.
These are mortgage loans that are "three monthly payments or more past due or in foreclosure".

Mortgages in forbearance are being counted as delinquent in this monthly report but are not reported to the credit bureaus.
Fannie Mae reported earlier.
Comments on January Case-Shiller and FHFA House Prices
by Calculated Risk on 3/28/2023 09:56:00 AM
Today, in the Calculated Risk Real Estate Newsletter: Case-Shiller: National House Price Index "Declining Trend Continued" to 3.8% year-over-year increase in January
Excerpt:
Both the Case-Shiller House Price Index (HPI) and the Federal Housing Finance Agency (FHFA) HPI for January were released today. Here is a graph of the month-over-month (MoM) change in the Case-Shiller National Index Seasonally Adjusted (SA).
The Case-Shiller Home Price Indices for "January" is a 3-month average of November, December and January closing prices. November closing prices include some contracts signed in September, so there is a significant lag to this data.
The MoM decrease in the seasonally adjusted Case-Shiller National Index was at -0.25%. This was the seventh consecutive MoM decrease, and a slightly smaller decrease than in December.
On a seasonally adjusted basis, prices declined in 15 of 20 Case-Shiller cities on a month-to-month basis. The largest monthly declines seasonally adjusted were in Seattle (-1.5%), Las Vegas (-1.1%), and Denver (-1.0%). Seasonally adjusted, San Francisco has fallen 13.2% from the peak in May 2022 and Seattle is down 11.4% from the peak. All 20 cities have seen price declines from the recent peak (SA).
Case-Shiller: National House Price Index "Declining Trend Continued" to 3.8% year-over-year increase in January
by Calculated Risk on 3/28/2023 09:11:00 AM
S&P/Case-Shiller released the monthly Home Price Indices for January ("January" is a 3-month average of November, December and January closing prices).
This release includes prices for 20 individual cities, two composite indices (for 10 cities and 20 cities) and the monthly National index.
From S&P: S&P Corelogic Case-Shiller Index Declining Trend Continued in January
The S&P CoreLogic Case-Shiller U.S. National Home Price NSA Index, covering all nine U.S. census divisions, reported a 3.8% annual gain in January, down from 5.6% in the previous month. The 10-City Composite annual increase came in at 2.5%, down from 4.4% in the previous month. The 20-City Composite posted a 2.5% year-over-year gain, down from 4.6% in the previous month.
Miami, Tampa, and Atlanta again reported the highest year-over-year gains among the 20 cities in January. Miami led the way with a 13.8% year-over-year price increase, followed by Tampa in second with a 10.5% increase, and Atlanta in third with an 8.4% increase. All 20 cities reported lower prices in the year ending January 2023 versus the year ending December 2022.
...
Before seasonal adjustment, the U.S. National Index posted a -0.5% month-over-month decrease in January, while the 10-City and 20-City Composites posted decreases of -0.5% and -0.6%, respectively.
After seasonal adjustment, the U.S. National Index posted a month-over-month decrease of -0.2%, while both the 10-City and 20-City Composites posted decreases of -0.4%.
In January, before seasonal adjustment, 19 cities reported declines with only Miami reporting an increase at 0.1%. After seasonal adjustment, 15 cities reported declines while Miami, Boston, Charlotte, and Cleveland had slight increases.
“2023 began as 2022 had ended, with U.S. home prices falling for the seventh consecutive month,” says Craig J. Lazzara, Managing Director at S&P DJI. “The National Composite declined by 0.5% in January, and now stands 5.1% below its peak in June 2022. On a trailing 12-month basis, the National Composite is only 3.8% ahead of its level in January 2022, a result also reflected in our 10- and 20-City Composites (both +2.5% year-over-year).
“January’s market weakness was broadly based. Before seasonal adjustment, 19 cities registered a decline; the seasonally adjusted picture is a bit brighter, with only 15 cities declining. With or without seasonal adjustment, most cities’ January declines were less severe than their December counterparts.
emphasis added
 Click on graph for larger image.
 The first graph shows the nominal seasonally adjusted Composite 10, Composite 20 and National indices (the Composite 20 was started in January 2000).
The Composite 10 index is down 0.4% in January (SA) and down 4.5% from the recent peak in June 2022.
The Composite 20 index is down 0.4% (SA) in January and down 4.7% from the recent peak in June 2022.
The National index is down 0.2% (SA) in January and is down 3.0% from the peak in June 2022.
 The second graph shows the year-over-year change in all three indices.
The Composite 10 SA is up 2.5% year-over-year. The Composite 20 SA is up 2.5% year-over-year.
The National index SA is up 3.8% year-over-year.
Annual price increases were at expectations. I'll have more later.
Monday, March 27, 2023
Tuesday: Case-Shiller House Prices
by Calculated Risk on 3/27/2023 08:26:00 PM

Mortgage rates hit their lowest levels in just over 6 weeks on Friday as investors braced for bad news in the banking sector. Such fears tend pull money out of the stock market and into bonds. Excess bond demand means lower rates, all other things being equal.Tuesday:
After a weekend without any new bank drama, investors were able to move back in the other direction. News regarding the sale of most of Silicon Valley Bank's deposits and loans only added to the momentum.
...
The average lender was down below 6.5% for a flawless 30yr fixed scenario on Friday, but is now back above. [30 year fixed 6.54%]
emphasis added
• At 9:00 AM ET, S&P/Case-Shiller House Price Index for January. The consensus is for a 2.5% year-over-year increase in the Comp 20 index for January, down from 4.6% YoY in December.
• Also at 9:00 AM, FHFA House Price Index for January 2021. This was originally a GSE only repeat sales, however there is also an expanded index.
• At 10:00 AM, Richmond Fed Survey of Manufacturing Activity for March. This is the last of the regional surveys for March.
Fannie Mae: Mortgage Serious Delinquency Rate Decreased in February
by Calculated Risk on 3/27/2023 04:23:00 PM
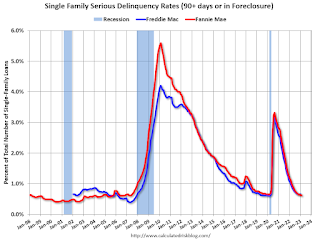
Fannie Mae reported that the Single-Family Serious Delinquency decreased to 0.62% in February from 0.64% in January. The serious delinquency rate is down from 1.11% in February 2022. This is below the pre-pandemic levels.
These are mortgage loans that are "three monthly payments or more past due or in foreclosure".
The Fannie Mae serious delinquency rate peaked in February 2010 at 5.59% following the housing bubble and peaked at 3.32% in August 2020 during the pandemic.

By vintage, for loans made in 2004 or earlier (1% of portfolio), 2.04% are seriously delinquent (down from 2.11% in January).
Mortgages in forbearance were counted as delinquent in this monthly report, but they were not reported to the credit bureaus.
DOT: Vehicle Miles Driven Increased 5.6% year-over-year in January
by Calculated Risk on 3/27/2023 02:42:00 PM
This is something I check occasionally.
The Department of Transportation (DOT) reported:
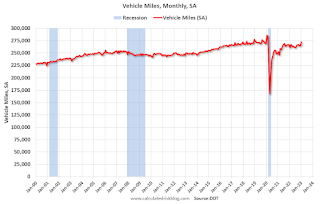
Travel on all roads and streets changed by +5.6% (+13.2 billion vehicle miles) for January 2023 as compared with January 2022. Travel for the month is estimated to be 247.3 billion vehicle miles.
The seasonally adjusted vehicle miles traveled for January 2023 is 272.5 billion miles, a 4.5% (11.6 billion vehicle miles) change over January 2022. It also represents a 3.1% change (8.1 billion vehicle miles) compared with December 2022.
emphasis added
 Click on graph for larger image.
This graph shows the monthly total vehicle miles driven, seasonally adjusted.
Miles driven declined sharply in March 2020, and really collapsed in April 2020. After recovering, miles driven were softer early in 2022 due to higher gasoline prices but have increased since gasoline prices are now down sharply year-over-year.
Housing March 27th Weekly Update: Inventory Decreased 0.3% Week-over-week
by Calculated Risk on 3/27/2023 08:34:00 AM
 Click on graph for larger image.
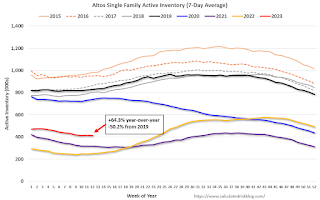
This inventory graph is courtesy of Altos Research.

Mike Simonsen discusses this data regularly on Youtube.


