 RSS Feed
 by Calculated Risk on 4/03/2023 04:21:00 PM
Monday, April 03, 2023
Q1 2023 Update: Unofficial Problem Bank list Decreased to 46 Institutions
The FDIC's official problem bank list is comprised of banks with a CAMELS rating of 4 or 5, and the list is not made public (just the number of banks and assets every quarter). Note: Bank CAMELS ratings are also not made public.
CAMELS is the FDIC rating system, and stands for Capital adequacy, Asset quality, Management, Earnings, Liquidity and Sensitivity to market risk. The scale is from 1 to 5, with 1 being the strongest.
As a substitute for the CAMELS ratings, surferdude808 is using publicly announced formal enforcement actions, and also media reports and company announcements that suggest to us an enforcement action is likely, to compile a list of possible problem banks in the public interest.
DISCLAIMER: This is an unofficial list, the information is from public sources only, and while deemed to be reliable is not guaranteed. No warranty or representation, expressed or implied, is made as to the accuracy of the information contained herein and same is subject to errors and omissions. This is not intended as investment advice. Please contact CR with any errors.
NOTE: I'm no longer updating the spreadsheet.
Here are the quarterly changes and a few comments from surferdude808:
A couple of comments: Regulators never disclosed the "whale" that added close to $116 billion to problem assets to the official problem list but has now been removed from the official list. And none of the recently failed banks had formal enforcement actions prior to failure.
Here are the quarterly changes and a few comments from surferdude808:
Update on the Unofficial Problem Bank List through March 31, 2023. Since the last update at the end of December 2022, the list decreased by three to 46 institutions after three removals. Assets decreased by $1.7 billion to $49.3 billion, about one-third of the drop was because of a $787 million decline from updated asset figures through December 31, 2022. A year ago, the list held 54 institutions with assets of $60.9 billion. Removals during the quarter because of action termination included Carver Federal Savings Bank, New York, NY ($713 million) and The City National Bank of Colorado City, Colorado City, TX ($237 million). First Savanna Savings Bank, Savanna, IL ($9 million) found its way off this list through a voluntary merger.
With the conclusion of the fourth quarter, we bring an updated transition matrix to detail how banks are transitioning off the Unofficial Problem Bank List. Since we first published the Unofficial Problem Bank List on August 7, 2009 with 389 institutions, 1,789 institutions have appeared on a weekly or monthly list since then. Only 2.6 percent of the banks that have appeared on a list remain today as 1,743 institutions have transitioned through the list. Departure methods include 1,031 action terminations, 411 failures, 282 mergers, and 19 voluntary liquidations. Of the 389 institutions on the first published list, only 3 or less than 1.0 percent, still have a troubled designation more than ten years later. The 411 failures represent 23 percent of the 1,789 institutions that have made an appearance on the list. This failure rate is well above the 10-12 percent rate frequently cited in media reports on the failure rate of banks on the FDIC's official list.
On February 28, 2023, the FDIC released fourth quarter results and provided an update on the Official Problem Bank List. While FDIC did not make a comment within its press release on the Official Problem Bank List, they provided details in an attachment that listed 39 institutions with assets of $47 billion. These figures were notable lower from last quarter when the FDIC said the Official Problem List had 42 institutions with assets of $164 billion. Hence during the quarter, the large unknown depository was removed. The $116 billion decline in assets provides some clues as to that unknown depository. At December 31, 2022, there were three depositories -- UBS Bank USA ($121 billion); USAA Federal Savings Bank ($111 billion); and First-Citizens Bank & Trust Company ($109 billion). Since First-Citizens Bank & Trust Company, it was likely not them as they are a SEC registrant and an enforcement action would be considered a material event requiring disclosure. Given that the parent of UBS Bank just acquired Credit Suisse, would they have been approved to complete that acquisition with a troubled subsidiary? Emergencies do cause the authorities to approve transactions that would not be permitted in stable periods. USAA Federal Savings Bank appears to be owned by its policyholders; if so, then it would not be subject to SEC disclosure rules. A few names, some details on their circumstances, we will let you handicap who the unknown whale was.
Since we last checked in with, there has been another banking sector dislocation event. There have been three bank failures – Silvergate Bank, Silicon valley Bank, and Signature Bank. Some common risk characteristics of the failed banks include a deposit base that was mostly uninsured (“hot money’), lack of diversification (industry, business line, and customer concentrations), and poorly managed liquidity position (illiquid securities that could not be sold). The large volume of uninsured deposits triggered runs at other depositories, forcing a systemic risk declaration to protect the uninsured depositors at Signature Bank and Silicon Valley Bank. Hearings this past week on the Hill exposed failures in the supervisory process and regulatory framework. Informed readers here know that before a bank fails, the risks should be identified by regulators and a corrective program be in place. In short, the bank should be operating under a formal enforcement action before it goes belly up. That was not the case here, as all three banks went straight to failure bypassing the desired orderly resolution. These failures messy and very disorderly. Hopefully, some prudent reforms are put in place to prevent a re-occurrence.
Black Knight Mortgage Monitor: Home Prices Increased Slightly in February; Prices Up 1.9% YoY
by Calculated Risk on 4/03/2023 11:14:00 AM
Today, in the Calculated Risk Real Estate Newsletter: Black Knight Mortgage Monitor: Home Prices Increased Slightly in February; Prices Up 1.9% YoY
A brief excerpt:
Here is a graph of the Black Knight HPI. The index is still up 1.9% year-over-year and will likely turn negative YoY soon.There is much more in the article. You can subscribe at https://calculatedrisk.substack.com/
• A modest easing of affordability in January and early February along with tightening inventory levels drove home prices slightly higher
• On an adjusted basis, prices were up 0.16% for the month, the strongest single month gain since May of last year, while non-adjusted they were up 0.68%
• The headline annual home price growth rate fell by 164 bps in the month to 1.94%, the first time we’ve seen annual home price growth below 2% since early 2012
• Price growth is expected to cross over into negative territory by April but may return above 0% before the end of the year if inventory challenges persist and interest rates ease
• All in, home prices nationally are now down 2.6% from their 2022 peak, marginally improved from 2.7% in January
emphasis added

Construction Spending Decreased 0.1% in February
by Calculated Risk on 4/03/2023 10:21:00 AM
From the Census Bureau reported that overall construction spending decreased:
Construction spending during February 2023 was estimated at a seasonally adjusted annual rate of $1,844.1 billion, 0.1 percent below the revised January estimate of $1,845.4 billion. The February figure is 5.2 percent above the February 2022 estimate of $1,753.1 billion.Private spending was "virtually unchanged" and public spending decreased:
emphasis added
Spending on private construction was at a seasonally adjusted annual rate of $1,453.2 billion, virtually unchanged from the revised January estimate of $1,453.6 billion. ...
In February, the estimated seasonally adjusted annual rate of public construction spending was $391.0 billion, 0.2 percent below the revised January estimate of $391.8 billion.
 Click on graph for larger image.
This graph shows private residential and nonresidential construction spending, and public spending, since 1993. Note: nominal dollars, not inflation adjusted.
Residential (red) spending is 9.8% below the recent peak.
Non-residential (blue) spending is at a new peak.
Public construction spending is close to the recent peak.
 The second graph shows the year-over-year change in construction spending.
On a year-over-year basis, private residential construction spending is down 5.7%. Non-residential spending is up 19.4% year-over-year. Public spending is up 12.8% year-over-year.
This was at consensus expectations of a 0.1% decrease in spending; however, construction spending for the previous two months was revised up.
ISM® Manufacturing index Decreased to 46.3% in March
by Calculated Risk on 4/03/2023 10:04:00 AM
(Posted with permission). The ISM manufacturing index indicated contraction. The PMI® was at 46.3% in March, down from 47.7% in February. The employment index was at 46.9%, down from 49.1% last month, and the new orders index was at 44.3%, up from 47.0%.
From ISM: Manufacturing PMI® at 46.3%
March 2023 Manufacturing ISM® Report On Business®
Economic activity in the manufacturing sector contracted in March for the fifth consecutive month following a 28-month period of growth, say the nation's supply executives in the latest Manufacturing ISM® Report On Business®.This suggests manufacturing contracted in March. This was below the consensus forecast.
The report was issued today by Timothy R. Fiore, CPSM, C.P.M., Chair of the Institute for Supply Management® (ISM®) Manufacturing Business Survey Committee:
“The March Manufacturing PMI® registered 46.3 percent, 1.4 percentage points lower than the 47.7 percent recorded in February. Regarding the overall economy, this figure indicates a fourth month of contraction after a 30-month period of expansion. The Manufacturing PMI® is at its lowest level since May 2020, when it registered 43.5 percent. The New Orders Index remained in contraction territory at 44.3 percent, 2.7 percentage points lower than the figure of 47 percent recorded in February. The Production Index reading of 47.8 percent is a 0.5-percentage point increase compared to February’s figure of 47.3 percent. The Prices Index registered 49.2 percent, down 2.1 percentage points compared to the February figure of 51.3 percent. The Backlog of Orders Index registered 43.9 percent, 1.2 percentage points lower than the February reading of 45.1 percent. The Employment Index continued in contraction territory, registering 46.9 percent, down 2.2 percentage points from February’s reading of 49.1 percent. The Supplier Deliveries Index figure of 44.8 percent is 0.4 percentage point lower than the 45.2 percent recorded in February; this is the index’s lowest reading since March 2009 (43.2 percent). The Inventories Index dropped into contraction at 47.5 percent, 2.6 percentage points lower than the February reading of 50.1 percent. The New Export Orders Index reading of 47.6 percent is 2.3 percentage points lower than February’s figure of 49.9 percent. The Imports Index continued in contraction territory at 47.9 percent, 2 percentage points below the 49.9 percent reported in February.”
emphasis added
Housing April 3rd Weekly Update: Inventory Decreased 0.8% Week-over-week
by Calculated Risk on 4/03/2023 08:18:00 AM
Altos reports that active single-family inventory was down 0.8% week-over-week. Inventory still hasn't bottomed seasonally!
 Click on graph for larger image.
This inventory graph is courtesy of Altos Research.
As of March 31st, inventory was at 410 thousand (7-day average), compared to 413 thousand the prior week.
Year-to-date, inventory is down 16.5%, and at the lowest point so far this year.

The red line is for 2023. The black line is for 2019. Note that inventory is up from the previous two years (the record low was in 2022), but still well below normal levels.
Inventory was up 62.2% compared to the same week in 2022 (last week it was up 64.3%), and down 50.8% compared to the same week in 2019 (last week down 50.2%).
A key will be when inventory starts increasing in 2023 - not yet!
Mike Simonsen discusses this data regularly on Youtube.
Sunday, April 02, 2023
Monday: ISM Mfg, Construction Spending, Vehicle Sales
by Calculated Risk on 4/02/2023 06:42:00 PM
Weekend:
• Schedule for Week of April 2, 2023
Monday:
• At 10:00 AM ET, ISM Manufacturing Index for March. The consensus is for the ISM to be at 47.5, down from 47.7 in February.
• Also at 10:00 AM, Construction Spending for February. The consensus is for 0.1% decrease in construction spending.
• All day, Light vehicle sales for March. The consensus is for light vehicle sales to be 14.9 million SAAR in March, unchanged from 14.9 million in February (Seasonally Adjusted Annual Rate).
From CNBC: Pre-Market Data and Bloomberg futures S&P 500 and DOW futures are down slightly (fair value).
Oil prices were up over the last week with WTI futures at $75.67 per barrel and Brent at $79.89 per barrel. A year ago, WTI was at $99, and Brent was at $106 - so WTI oil prices are DOWN 23% year-over-year.
Here is a graph from Gasbuddy.com for nationwide gasoline prices. Nationally prices are at $3.48 per gallon. A year ago, prices were at $4.20 per gallon, so gasoline prices are down $0.72 per gallon year-over-year.
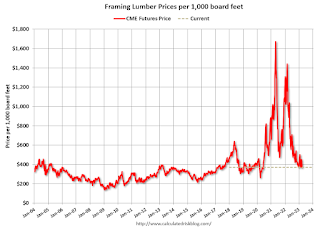
Update: Framing Lumber Prices Down 63% YoY, Below Pre-Pandemic Levels
by Calculated Risk on 4/02/2023 10:23:00 AM
Here is another monthly update on framing lumber prices.
This graph shows CME random length framing futures through March 31st.
Lumber is currently at $360 per 1000 board feet.
This is down from the peak of $1,733, and down 63% from $1008 a year ago.
Prices are below the pre-pandemic levels of around $400.
 Click on graph for larger image.
It is unlikely we will see a significant runup in prices this Spring due to the housing slowdown.
Prices are below the pre-pandemic levels of around $400.
 Click on graph for larger image.
There is somewhat of a seasonal demand for lumber, and lumber prices usually peak in April or May.
It is unlikely we will see a significant runup in prices this Spring due to the housing slowdown.
Saturday, April 01, 2023
Real Estate Newsletter Articles this Week: "Price-to-rent index is 7.9% below recent peak"
by Calculated Risk on 4/01/2023 02:11:00 PM
At the Calculated Risk Real Estate Newsletter this week:
• Inflation Adjusted House Prices 4.6% Below Peak Price-to-rent index is 7.9% below recent peak
• Year-over-year Rent Growth Continues to Decelerate
• Case-Shiller: National House Price Index "Declining Trend Continued" to 3.8% year-over-year increase in January
• Freddie Mac House Price Index Declines for 8th Consecutive Month in February
This is usually published 4 to 6 times a week and provides more in-depth analysis of the housing market.
You can subscribe at https://calculatedrisk.substack.com/
Most content is available for free (and no Ads), but please subscribe!
Schedule for Week of April 2, 2023
by Calculated Risk on 4/01/2023 08:11:00 AM
The key report scheduled for this week is the March employment report on Friday.
Other key reports include the February Trade Deficit and March Auto Sales.
For manufacturing, the March ISM Manufacturing survey will be released.
10:00 AM: ISM Manufacturing Index for March. The consensus is for the ISM to be at 47.5, down from 47.7 in February.
10:00 AM: Construction Spending for February. The consensus is for 0.1% decrease in construction spending.
 All Day: Light vehicle sales for March. The consensus is for light vehicle sales to be 14.9 million SAAR in March, unchanged from 14.9 million in February (Seasonally Adjusted Annual Rate).
This graph shows light vehicle sales since the BEA started keeping data in 1967. The dashed line is the February sales rate.
8:00 AM: Corelogic House Price index for February.
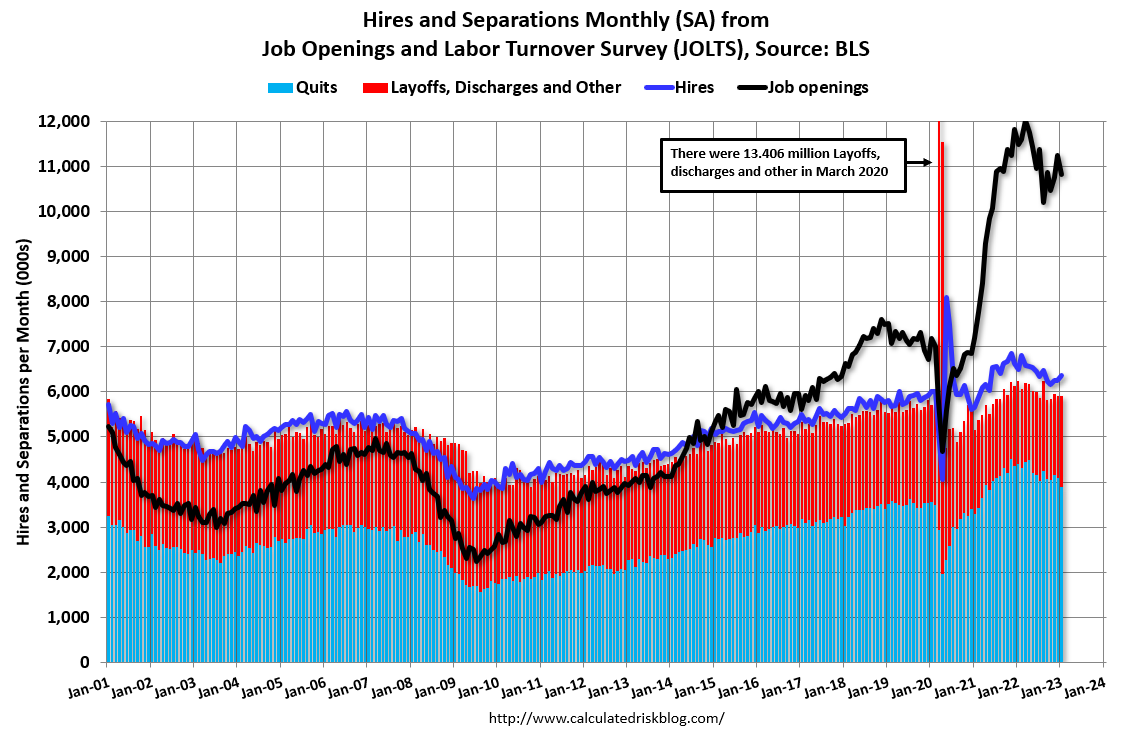 10:00 AM ET: Job Openings and Labor Turnover Survey for February from the BLS.
 This graph shows job openings (black line), hires (dark blue), Layoff, Discharges and other (red column), and Quits (light blue column) from the JOLTS.
Jobs openings decreased in January to 10.8 million from 11.2 million in December.
7:00 AM ET: The Mortgage Bankers Association (MBA) will release the results for the mortgage purchase applications index.
8:15 AM: The ADP Employment Report for March. This report is for private payrolls only (no government). The consensus is for 200,000 payroll jobs added in March, down from 242,000 added in February.
 8:30 AM: Trade Balance report for February from the Census Bureau.
 This graph shows the U.S. trade deficit, with and without petroleum, through the most recent report. The blue line is the total deficit, and the black line is the petroleum deficit, and the red line is the trade deficit ex-petroleum products.
The consensus is the trade deficit to be $68.7 billion. The U.S. trade deficit was at $68.3 billion in January.
10:00 AM: the ISM Services Index for March.
8:30 AM: The initial weekly unemployment claims report will be released. The consensus is for 196 thousand initial claims, down from 198 thousand last week.
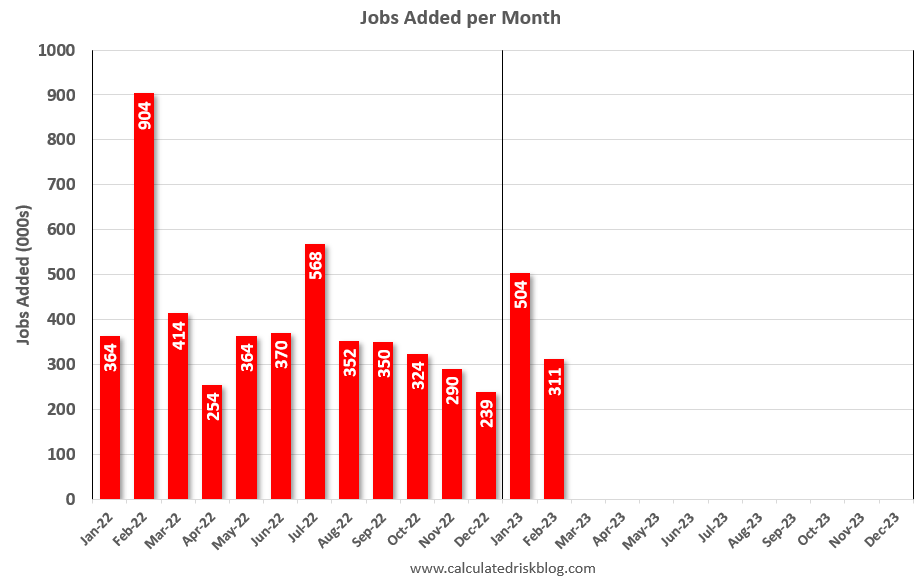 8:30 AM: Employment Report for March. The consensus is for 240,000 jobs added, and for the unemployment rate to be unchanged at 3.6%.
There were 311,000 jobs added in February, and the unemployment rate was at 3.6%.
This graph shows the jobs added per month since January 2022.
Friday, March 31, 2023
COVID Mar 31, 2023: Update on Cases, Hospitalizations and Deaths
by Calculated Risk on 3/31/2023 09:10:00 PM
 Note: Mortgage rates are from MortgageNewsDaily.com and are for top tier scenarios.
On COVID (focus on hospitalizations and deaths). Data is now weekly.
After the first few weeks, the pandemic low for weekly deaths was the week of July 7, 2021, at 1,690 deaths.
Weekly deaths just set a new pandemic low at 1,596, although the data might be revised up.
| COVID Metrics | ||||
|---|---|---|---|---|
| Now | Week Ago | Goal | ||
| New Cases per Week2 | 139,931 | 154,244 | ≤35,0001 | |
| Hospitalized2 | 14,650 | 15,965 | ≤3,0001 | |
| Deaths per Week2 | 1,596 | 2,260 | ≤3501 | |
| 1my goals to stop weekly posts, 2Weekly for Cases, Currently Hospitalized, and Deaths 🚩 Increasing number weekly for Cases, Hospitalized, and Deaths ✅ Goal met. | ||||
 Click on graph for larger image.
This graph shows the weekly (columns) number of deaths reported.
For cases, the low was 82,186.
For COVID hospitalizations, the low was 9,821.


