by Calculated Risk on 4/06/2023 08:41:00 AM
Thursday, April 06, 2023
Weekly Initial Unemployment Claims decrease to 228,000; Major Revisions to Seasonal Factors
NOTE: This release has "revisions to the historical series for CY 2018-2022 for both initial claims and continued claims". And "Beginning with the Unemployment Insurance (UI) Weekly Claims News Release issued Thursday, April 6, 2023, the methodology used to seasonally adjust the national initial claims and continued claims reflects a change in the estimation of the models."
The DOL reported:
In the week ending April 1, the advance figure for seasonally adjusted initial claims was 228,000, a decrease of 18,000 from the previous week's revised level. The previous week's level was revised up by 48,000 from 198,000 to 246,000. The 4-week moving average was 237,750, a decrease of 4,250 from the previous week's revised average. The previous week's average was revised up by 43,750 from 198,250 to 242,000.The following graph shows the 4-week moving average of weekly claims since 1971.
emphasis added
 Click on graph for larger image.
The dashed line on the graph is the current 4-week average. The four-week average of weekly unemployment claims decreased to 237,750.
The previous week was revised up.
Weekly claims were well above the consensus forecast.
Wednesday, April 05, 2023
Thursday: Unemployment Claims
by Calculated Risk on 4/05/2023 09:37:00 PM

Thursday:
• At 8:30 AM ET, The initial weekly unemployment claims report will be released. The consensus is for 196 thousand initial claims, down from 198 thousand last week.
Update: Comparing the Current Housing Cycle to the 1980 Period
by Calculated Risk on 4/05/2023 10:41:00 AM
Today, in the Calculated Risk Real Estate Newsletter: Update: Comparing the Current Housing Cycle to the 1980 Period
Excerpt:
A year ago, I wrote: Housing: Don't Compare the Current Housing Boom to the Bubble and BustIt is natural to compare the current housing boom to the mid-00s housing bubble. The bubble and subsequent bust are part of our collective memories. And graphs of nominal house prices and price-to-rent ratios look eerily similar to the housing bubble.Here is an update to several of the graphs I posted comparing the current situation to the 1980 period.
However, there are significant differences. First, lending has been reasonably solid during the current boom, whereas in the mid-00s, underwriting standards were almost non-existent (“fog a mirror, get a loan”). And demographics are much more favorable today than in the mid-00s.
A much more similar period to today is the late ‘70s and early ‘80s. House prices were increasing sharply. Demographics were very favorable for homebuying as the baby boomers moved into the first-time homebuying age group (similar to the millennials now). And inflation picked up from an already elevated level due to the second oil embargo in 1979, followed by the Iran-Iraq war in 1980, driving up costs.
...
Although mortgage rates are much lower than in the 1980 period, it is the Change in Monthly Payment that Matters! Monthly payments include principal, interest, taxes, insurance (PITI), and sometimes HOA fees (Homeowners Association). We could also include maintenance, utilities and other costs.
The following graph shows the year-over-year change in principal & interest (P&I) assuming a fixed loan amount since 1977. Currently P&I is up about 30% year-over-year for a fixed amount (this doesn’t take into account the change in house prices).
The peak YoY change in P&I was similar to 1979.
...
I’ll have much more on the lessons from the 1980 period, and what this likely means going forward for housing.
ISM® Services Index Decreases to 51.2% in March
by Calculated Risk on 4/05/2023 10:04:00 AM
(Posted with permission). The ISM® Services index was at 51.2%, down from 55.1% last month. The employment index decreased to 51.3%, from 54.0%. Note: Above 50 indicates expansion, below 50 in contraction.
From the Institute for Supply Management: Services PMI® at 51.2% March 2023 Services ISM® Report On Business®
Economic activity in the services sector expanded in March for the third consecutive month as the Services PMI® registered 51.2 percent, say the nation's purchasing and supply executives in the latest Services ISM® Report On Business®. The sector has grown in 33 of the last 34 months, with the lone contraction in December.The PMI was much lower than expected and the employment index declined.
The report was issued today by Anthony Nieves, CPSM, C.P.M., A.P.P., CFPM, Chair of the Institute for Supply Management® (ISM®) Services Business Survey Committee: “In March, the Services PMI® registered 51.2 percent, 3.9 percentage points lower than February’s reading of 55.1 percent. The composite index indicated growth in March for the third consecutive month after a reading of 49.2 percent in December, the first contraction since May 2020 (45.4 percent). The Business Activity Index registered 55.4 percent, a 0.9-percentage point decrease compared to the reading of 56.3 percent in February. The New Orders Index expanded in March for the third consecutive month after contracting in December for the first time since May 2020; the figure of 52.2 percent is 10.4 percentage points lower than the February reading of 62.6 percent.
“The Supplier Deliveries registered 45.8 percent, 1.8 percentage points lower than the 47.6 percent recorded in February. In the last two months, the index has reflected the fastest supplier delivery performance since April 2009, when it registered 45.5 percent. (Supplier Deliveries is the only ISM® Report On Business® index that is inversed; a reading of above 50 percent indicates slower deliveries, which is typical as the economy improves and customer demand increases.)
“The Prices Index was down 6.1 percentage points in March, to 59.5 percent. The Inventories Index grew in March for the second consecutive month after contracting for eight months in a row; the reading of 52.8 percent is up 2.2 percentage points from February’s figure of 50.6 percent. The Inventory Sentiment Index (57.9 percent, up 2.6 percentage points from February’s reading of 55.3 percent) expanded for the fourth consecutive month after a four-month period of contraction.
“Thirteen industries reported growth in March. The Services PMI®, by being above 50 percent for a third month after a single month of contraction and a prior 30-month period of expansion, continues to indicate sustained growth for the sector. The composite index has indicated expansion for all but three of the previous 158 months.”
Nieves continues, “There has been a pullback in the rate of growth for the services sector, attributed mainly to (1) a cooling off in the new orders growth rate, (2) an employment environment that varies by industry and (3) continued improvements in capacity and logistics, a positive impact on supplier performance. The majority of respondents report a positive outlook on business conditions.”
emphasis added
Trade Deficit increased to $70.5 Billion in February
by Calculated Risk on 4/05/2023 08:48:00 AM
From the Department of Commerce reported:
The U.S. Census Bureau and the U.S. Bureau of Economic Analysis announced today that the goods and services deficit was $70.5 billion in February, up $1.9 billion from $68.7 billion in January, revised.
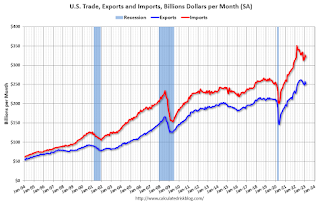
February exports were $251.2 billion, $6.9 billion less than January exports. February imports were $321.7 billion, $5.0 billion less than January imports.
emphasis added
 Click on graph for larger image.
Both exports and imports decreased in February.
Exports are up 8% year-over-year; imports are up 1% year-over-year.
Both imports and exports decreased sharply due to COVID-19 and then bounced back - but imports have been decreasing recently.
The second graph shows the U.S. trade deficit, with and without petroleum.
 The blue line is the total deficit, and the black line is the petroleum deficit, and the red line is the trade deficit ex-petroleum products.
Note that net, exports of petroleum products are positive.
The trade deficit with China decreased to $19.0 billion in January, from $30.7 billion a year ago.
ADP: Private Employment Increased 145,000 in March
by Calculated Risk on 4/05/2023 08:19:00 AM
Private sector employment increased by 145,000 jobs in March and annual pay was up 6.9 percent year-over-year, according to the March ADP® National Employment ReportTM produced by the ADP Research Institute® in collaboration with the Stanford Digital Economy Lab (“Stanford Lab”)This was below the consensus forecast of 200,000. The BLS report will be released Friday, and the consensus is for 240 thousand non-farm payroll jobs added in March.
...
“Our March payroll data is one of several signals that the economy is slowing,” said Nela Richardson, chief economist, ADP. “Employers are pulling back from a year of strong hiring and pay growth, after a three-month plateau, is inching down.”
emphasis added
MBA: Mortgage Purchase Applications Decreased in Weekly Survey
by Calculated Risk on 4/05/2023 07:00:00 AM
From the MBA: Mortgage Applications Decrease in Latest MBA Weekly Survey
Mortgage applications decreased 4.1 percent from one week earlier, according to data from the Mortgage Bankers Association’s (MBA) Weekly Mortgage Applications Survey for the week ending March 31, 2023.
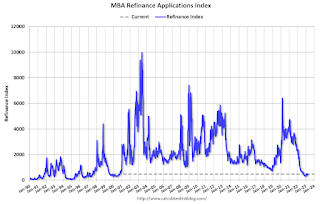
The Market Composite Index, a measure of mortgage loan application volume, decreased 4.1 percent on a seasonally adjusted basis from one week earlier. On an unadjusted basis, the Index decreased 4 percent compared with the previous week. The Refinance Index decreased 5 percent from the previous week and was 59 percent lower than the same week one year ago. The seasonally adjusted Purchase Index decreased 4 percent from one week earlier. The unadjusted Purchase Index decreased 3 percent compared with the previous week and was 35 percent lower than the same week one year ago.
“Spring has arrived, but the housing market is missing the customary burst in listings and purchase activity that typically mark the season. After four weeks of increasing purchase application activity, volume declined a bit this week even with another small drop in mortgage rates,” said Mike Fratantoni, MBA’s SVP and Chief Economist. “Additionally, refinance application volume continues to be quite low. Although the mortgage rate for conforming balance loans declined by five basis points over the week to 6.40 percent, the mortgage rate for jumbo loans increased by nine basis points to 6.36 percent. While we have seen relative weakness at the high end of the housing market in recent months, the divergence in rates suggests that banks may be tightening credit in response to recent challenges, preserving balance sheet capacity as deposit balances have declined. In recent years, most jumbo loans have been kept on depository balance sheets.”
Added Fratantoni: “At the entry-level segment of the market, purchase applications for both FHA and VA loans decreased last week. We do expect strong demand from first-time homebuyers over the next several years given the large number of millennials hitting peak first-time homebuyer age, but affordability remains a real challenge in this environment.”
..
The average contract interest rate for 30-year fixed-rate mortgages with conforming loan balances ($726,200 or less) decreased to 6.40 percent from 6.45 percent, with points decreasing to 0.59 from 0.62 (including the origination fee) for 80 percent loan-to-value ratio (LTV) loans.
emphasis added
 Click on graph for larger image.
The first graph shows the MBA mortgage purchase index.
According to the MBA, purchase activity is down 35% year-over-year unadjusted.

Tuesday, April 04, 2023
Wednesday: Trade Deficit, ISM Services, ADP Employment
by Calculated Risk on 4/04/2023 09:17:00 PM

Wednesday:
• At 7:00 AM ET, The Mortgage Bankers Association (MBA) will release the results for the mortgage purchase applications index.
• At 8:15 AM, The ADP Employment Report for March. This report is for private payrolls only (no government). The consensus is for 200,000 payroll jobs added in March, down from 242,000 added in February.
• At 8:30 AM, Trade Balance report for February from the Census Bureau. The consensus is the trade deficit to be $68.7 billion. The U.S. trade deficit was at $68.3 billion in January.
• At 10:00 AM, the ISM Services Index for March.
Moody's: Office Vacancy Rate Increased in Q1, Mall Vacancy Rate Unchanged
by Calculated Risk on 4/04/2023 05:04:00 PM
From Moody’s Analytics Senior Economist Lu Chen and economist Nick Luettke: Apartment temporarily oversupplied, Office approaching peak of vacancy, and Retail remained flat
Demand for office space extended its downward trend in Q1 as companies adjusted to uniquely designed hybrid models and strategically consolidated real estate space to improve operating margins. At the national level, more than 5 million square feet (sqft) was released back to the market this quarter. Meanwhile, construction slowed further with just over 3 million sqft of new space delivered in Q1. Vacancy rose to 19.0%, up 20 bps from a quarter-ago due to oversupplied stock and exceeding the pandemic peak of 18.5%. Office vacancies rose for the 5th consecutive quarter, another step closer to its historic peak of 19.3% in 1991. Asking rents increased by 0.4% in Q1 despite the rise in vacancies, likely an outcome of inflationary pressures.
The pandemic has accelerated market trends regarding how and where we work. Hybrid models have readily become adopted, though significant portions of the market remain either entirely in person or remote. With individual firms adopting competing models for specific business needs, a universal standard has yet to emerge. 2023 is poised to be a year of adaptation, or even innovation, as firms weigh their choices among location, size, and amenities given increased availability.
emphasis added
 Click on graph for larger image.
This graph shows the office vacancy rate starting in 1980 (prior to 1999 the data is annual).
And from Moody's on Retail:
Retail suffered the most when the Great Financial Crisis (GFC) hit in 2008. Oversupply and three years of negative retail net absorption increased the average vacancy from 6-7% to 10-11%. Since then, several factors weakened supply growth: developers became more cautious, demand dampened with the rise of e-commerce, and consumer preferences gradually changed. COVID-19 and the upsurge of remote work exacerbated retail woes, but this shock did not cause a freefall similar to the GFC because the sector was stumbling in the decade leading up to the pandemic. According to the latest Census Advanced Monthly Retail Trade Survey, total sales in February were up 5.4% from the same period a year ago, with food service/drinking places and general merchandise stores enjoying double-digit growth.
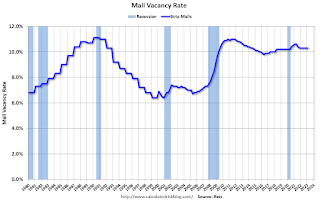
Supported by resilient consumer spending, neighborhood and community shopping center performance remained stable. However, with consumer confidence index starting to show subtle changes in consumers’ spending plan with less incentive towards service and stationary spending over the next six months, new retail construction and net absorption both came in light for the first quarter of the year. Vacancy flatlined at 10.3% over the past four quarters. Asking/effective rents were up slightly by 0.2%/0.3% in Q4 and remained in the $21/$18-per-sqft range, a level unchanged since 2018.
 This graph shows the strip mall vacancy rate starting in 1980 (prior to 2000 the data is annual).
 In the mid-'00s, mall investment picked up as mall builders followed the "roof tops" of the residential boom (more loose lending). This led to the vacancy rate moving higher even before the recession started. Then there was a sharp increase in the vacancy rate during the recession and financial crisis.
Heavy Truck Sales Up 7% Year-over-year in March
by Calculated Risk on 4/04/2023 01:00:00 PM
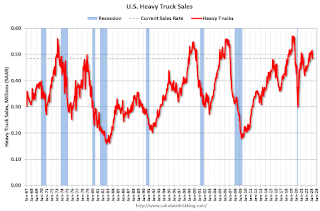
This graph shows heavy truck sales since 1967 using data from the BEA. The dashed line is the March 2023 seasonally adjusted annual sales rate (SAAR).
Heavy truck sales really collapsed during the great recession, falling to a low of 180 thousand SAAR in May 2009. Then heavy truck sales increased to a new all-time high of 570 thousand SAAR in April 2019.
 Click on graph for larger image.
Note: "Heavy trucks - trucks more than 14,000 pounds gross vehicle weight."
Heavy truck sales declined sharply at the beginning of the pandemic, falling to a low of 308 thousand SAAR in May 2020.


