 RSS Feed
 by Calculated Risk on 4/06/2023 09:33:00 PM
Thursday, April 06, 2023
Friday: Employment Report
 Note: Mortgage rates are from MortgageNewsDaily.com and are for top tier scenarios.
Friday:
• At 8:30 AM ET, Employment Report for March. The consensus is for 240,000 jobs added, and for the unemployment rate to be unchanged at 3.6%.
March Employment Preview
by Calculated Risk on 4/06/2023 04:29:00 PM
On Friday at 8:30 AM ET, the BLS will release the employment report for March. The consensus is for 240,000 jobs added, and for the unemployment rate to be unchanged at 3.6%.
From BofA economists:
"For the March employment report, we forecast a 265k increase in nonfarm payrolls. ... Weather is the main reason why we expect the pace of hiring to have moderated slightly in March. January and February were both unseasonably warm with limited snowfall, which according to estimates from the San Francisco Fed boosted growth in payrolls in both months. Climate data for March, however, is much more in line with seasonal norms. Therefore, we don’t expect to see the same weather boost. ... we expect the unemployment rate to fall by a tenth to 3.5%. "From Goldman Sachs:
"We estimate nonfarm payrolls rose 260k in March (mom sa) ... We estimate the unemployment rate was unchanged at 3.6%."• ADP Report: The ADP employment report showed 145,000 private sector jobs were added in March. This suggests job gains below consensus expectations, however, in general, ADP hasn't been very useful in forecasting the BLS report.
• ISM Surveys: Note that the ISM services are diffusion indexes based on the number of firms hiring (not the number of hires). The ISM® manufacturing employment index decreased in March to 46.9%, down from 49.1% last month. This would suggest about 35,000 jobs lost in manufacturing. The ADP report indicated 30,000 manufacturing jobs lost in March.
The ISM® services employment index decreased in March to 51.3%, from 54.0% last month. This would suggest service employment increased 110,000 in March.
Combined, the ISM surveys suggest 75,000 jobs added in March (well below the consensus forecast).
• Unemployment Claims: The weekly claims report showed an increase in the number of initial unemployment claims during the reference week (includes the 12th of the month) from 217,000 in February to 247,000 in March. This would usually suggest more layoffs in March than in February.
• COVID: As far as the pandemic, the number of weekly cases during the reference week in March was around 165,000, down from 263,000 in February.
• Weather: In January and February, the San Francisco Fed estimated that weather adjusted employment gains added 150+ thousand to the employment reports, and there should be some payback in March.
• Conclusion: a 240K report would be solid given the various indicators suggesting a slowdown in the economy. Some of the usual indicators - like the ISM report and the unemployment claims - suggest a sharp slowdown in job growth in March. I'll take the under this month.
Mortgage Rate Update
by Calculated Risk on 4/06/2023 03:04:00 PM
Today, in the Calculated Risk Real Estate Newsletter: Mortgage Rate Update
Excerpt:
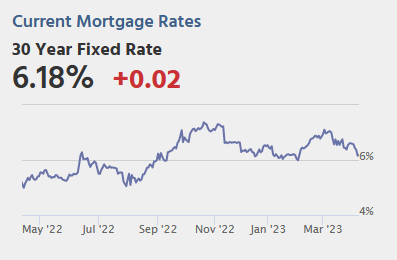
Mortgage News Daily reports that the most prevalent 30-year fixed rate is now at 6.18% for top tier scenarios. Usually there is a fairly steady spread between the ten-year Treasury yield and 30-year mortgage rates, although - as housing economist Tom Lawler explained in Mortgage/Treasury Spreads, Part I and Part II - the spread has widened due to several factors including volatility and pre-payment speeds.
With the ten-year yield at 3.3%, and based on an historical relationship, 30-year rates would currently be around 5.0%. So, mortgage rates are higher than expected based on the ten-year yield - for reasons Lawler explained
The graph shows the relationship between the monthly 10-year Treasury Yield and 30-year mortgage rates from the Freddie Mac survey. Note that the red dots are the last 12 months of data.

There is much more in the article. You can subscribe at https://calculatedrisk.substack.com/
Hotels: Occupancy Rate Down 3.5% Compared to Same Week in 2019
by Calculated Risk on 4/06/2023 11:25:00 AM
Aligned with normal spring break patterns, U.S. hotel performance showed mix comparisons from the previous week, according to STR‘s latest data through April 1.The following graph shows the seasonal pattern for the hotel occupancy rate using the four-week average.
March 26 through April 1, 2023 (percentage change from comparable weeks in 2022, 2019):
• Occupancy: 66.2% (+3.4%, -3.5%)
• Average daily rate (ADR): $158.40 (+7.3%, +19.9%)
• Revenue per available room (RevPAR): $104.78 (+10.9%, +15.7%)
emphasis added
 Click on graph for larger image.
The red line is for 2023, black is 2020, blue is the median, and dashed light blue is for 2022. Dashed purple is 2019 (STR is comparing to a strong year for hotels).
The 4-week average of the occupancy rate is close to the median rate for the previous 20 years (Blue).
Note: Y-axis doesn't start at zero to better show the seasonal change.
The 4-week average of the occupancy rate will move more sideways until the Summer.
Realtor.com Reports Weekly Active Inventory Up 53% YoY; New Listings Down 22% YoY
by Calculated Risk on 4/06/2023 09:54:00 AM
Realtor.com has monthly and weekly data on the existing home market. Here is their weekly report released today from Sabrina Speianu: Weekly Housing Trends View — Data Week Ending Apr 1, 2023
• Active inventory growth continued to climb, but at a lower rate, with for-sale homes up 53% above one year ago. The inventory of for-sale homes rose compared to last year, but at a slower pace than the previous week for a third time in a row as a smaller number of hopeful homebuyers still outnumber new sellers on the market. Typically by this point in the spring season, the inventory of homes for sale is 2 to 3 percent higher than January-levels. However, the inventory of homes for sale was 11 percent lower than the beginning of the year after 13 weeks of declines. While home inventory was higher than the same week in the last two years, this was primarily driven by longer time on market. The inventory of homes for sale remained at nearly half of what it was several years ago before the pandemic.
...
• New listings–a measure of sellers putting homes up for sale–were again down, this week by 22% from one year ago. The number of newly listed homes has been lower than the same time the previous year for the past 39 weeks. This past week, the gap from last year increased slightly but has remained in the -20% to -22% range for the past three weeks. While newly listed homes are increasing for the spring season, this seasonal uptick remains lower than all previous years on record since 2017.
 Here is a graph of the year-over-year change in inventory according to realtor.com.
 Inventory is still up sharply year-over-year - from record lows - however, the YoY increase has slowed recently.
Weekly Initial Unemployment Claims decrease to 228,000; Major Revisions to Seasonal Factors
by Calculated Risk on 4/06/2023 08:41:00 AM
NOTE: This release has "revisions to the historical series for CY 2018-2022 for both initial claims and continued claims". And "Beginning with the Unemployment Insurance (UI) Weekly Claims News Release issued Thursday, April 6, 2023, the methodology used to seasonally adjust the national initial claims and continued claims reflects a change in the estimation of the models."
The DOL reported:
In the week ending April 1, the advance figure for seasonally adjusted initial claims was 228,000, a decrease of 18,000 from the previous week's revised level. The previous week's level was revised up by 48,000 from 198,000 to 246,000. The 4-week moving average was 237,750, a decrease of 4,250 from the previous week's revised average. The previous week's average was revised up by 43,750 from 198,250 to 242,000.The following graph shows the 4-week moving average of weekly claims since 1971.
emphasis added
 Click on graph for larger image.
The dashed line on the graph is the current 4-week average. The four-week average of weekly unemployment claims decreased to 237,750.
The previous week was revised up.
Weekly claims were well above the consensus forecast.
Wednesday, April 05, 2023
Thursday: Unemployment Claims
by Calculated Risk on 4/05/2023 09:37:00 PM
 Note: Mortgage rates are from MortgageNewsDaily.com and are for top tier scenarios.
Thursday:
• At 8:30 AM ET, The initial weekly unemployment claims report will be released. The consensus is for 196 thousand initial claims, down from 198 thousand last week.
Update: Comparing the Current Housing Cycle to the 1980 Period
by Calculated Risk on 4/05/2023 10:41:00 AM
Today, in the Calculated Risk Real Estate Newsletter: Update: Comparing the Current Housing Cycle to the 1980 Period
Excerpt:
A year ago, I wrote: Housing: Don't Compare the Current Housing Boom to the Bubble and BustIt is natural to compare the current housing boom to the mid-00s housing bubble. The bubble and subsequent bust are part of our collective memories. And graphs of nominal house prices and price-to-rent ratios look eerily similar to the housing bubble.Here is an update to several of the graphs I posted comparing the current situation to the 1980 period.
However, there are significant differences. First, lending has been reasonably solid during the current boom, whereas in the mid-00s, underwriting standards were almost non-existent (“fog a mirror, get a loan”). And demographics are much more favorable today than in the mid-00s.
A much more similar period to today is the late ‘70s and early ‘80s. House prices were increasing sharply. Demographics were very favorable for homebuying as the baby boomers moved into the first-time homebuying age group (similar to the millennials now). And inflation picked up from an already elevated level due to the second oil embargo in 1979, followed by the Iran-Iraq war in 1980, driving up costs.
...
Although mortgage rates are much lower than in the 1980 period, it is the Change in Monthly Payment that Matters! Monthly payments include principal, interest, taxes, insurance (PITI), and sometimes HOA fees (Homeowners Association). We could also include maintenance, utilities and other costs.
The following graph shows the year-over-year change in principal & interest (P&I) assuming a fixed loan amount since 1977. Currently P&I is up about 30% year-over-year for a fixed amount (this doesn’t take into account the change in house prices).
The peak YoY change in P&I was similar to 1979.
...
I’ll have much more on the lessons from the 1980 period, and what this likely means going forward for housing.

There is much more in the article. You can subscribe at https://calculatedrisk.substack.com/
ISM® Services Index Decreases to 51.2% in March
by Calculated Risk on 4/05/2023 10:04:00 AM
(Posted with permission). The ISM® Services index was at 51.2%, down from 55.1% last month. The employment index decreased to 51.3%, from 54.0%. Note: Above 50 indicates expansion, below 50 in contraction.
From the Institute for Supply Management: Services PMI® at 51.2% March 2023 Services ISM® Report On Business®
Economic activity in the services sector expanded in March for the third consecutive month as the Services PMI® registered 51.2 percent, say the nation's purchasing and supply executives in the latest Services ISM® Report On Business®. The sector has grown in 33 of the last 34 months, with the lone contraction in December.The PMI was much lower than expected and the employment index declined.
The report was issued today by Anthony Nieves, CPSM, C.P.M., A.P.P., CFPM, Chair of the Institute for Supply Management® (ISM®) Services Business Survey Committee: “In March, the Services PMI® registered 51.2 percent, 3.9 percentage points lower than February’s reading of 55.1 percent. The composite index indicated growth in March for the third consecutive month after a reading of 49.2 percent in December, the first contraction since May 2020 (45.4 percent). The Business Activity Index registered 55.4 percent, a 0.9-percentage point decrease compared to the reading of 56.3 percent in February. The New Orders Index expanded in March for the third consecutive month after contracting in December for the first time since May 2020; the figure of 52.2 percent is 10.4 percentage points lower than the February reading of 62.6 percent.
“The Supplier Deliveries registered 45.8 percent, 1.8 percentage points lower than the 47.6 percent recorded in February. In the last two months, the index has reflected the fastest supplier delivery performance since April 2009, when it registered 45.5 percent. (Supplier Deliveries is the only ISM® Report On Business® index that is inversed; a reading of above 50 percent indicates slower deliveries, which is typical as the economy improves and customer demand increases.)
“The Prices Index was down 6.1 percentage points in March, to 59.5 percent. The Inventories Index grew in March for the second consecutive month after contracting for eight months in a row; the reading of 52.8 percent is up 2.2 percentage points from February’s figure of 50.6 percent. The Inventory Sentiment Index (57.9 percent, up 2.6 percentage points from February’s reading of 55.3 percent) expanded for the fourth consecutive month after a four-month period of contraction.
“Thirteen industries reported growth in March. The Services PMI®, by being above 50 percent for a third month after a single month of contraction and a prior 30-month period of expansion, continues to indicate sustained growth for the sector. The composite index has indicated expansion for all but three of the previous 158 months.”
Nieves continues, “There has been a pullback in the rate of growth for the services sector, attributed mainly to (1) a cooling off in the new orders growth rate, (2) an employment environment that varies by industry and (3) continued improvements in capacity and logistics, a positive impact on supplier performance. The majority of respondents report a positive outlook on business conditions.”
emphasis added
Trade Deficit increased to $70.5 Billion in February
by Calculated Risk on 4/05/2023 08:48:00 AM
From the Department of Commerce reported:
The U.S. Census Bureau and the U.S. Bureau of Economic Analysis announced today that the goods and services deficit was $70.5 billion in February, up $1.9 billion from $68.7 billion in January, revised.
February exports were $251.2 billion, $6.9 billion less than January exports. February imports were $321.7 billion, $5.0 billion less than January imports.
emphasis added
 Click on graph for larger image.
Both exports and imports decreased in February.
Exports are up 8% year-over-year; imports are up 1% year-over-year.
Both imports and exports decreased sharply due to COVID-19 and then bounced back - but imports have been decreasing recently.
The second graph shows the U.S. trade deficit, with and without petroleum.
 The blue line is the total deficit, and the black line is the petroleum deficit, and the red line is the trade deficit ex-petroleum products.
Note that net, exports of petroleum products are positive.
The trade deficit with China decreased to $19.0 billion in January, from $30.7 billion a year ago.
The trade deficit was larger than the consensus forecast.


