 RSS Feed
 by Calculated Risk on 4/08/2023 08:11:00 AM
Saturday, April 08, 2023
Schedule for Week of April 9, 2023
The key reports this week are March CPI and retail sales.
For manufacturing, the March Industrial Production report will be released this week.
No major economic releases scheduled.
6:00 AM ET: NFIB Small Business Optimism Index for March.
7:00 AM ET: The Mortgage Bankers Association (MBA) will release the results for the mortgage purchase applications index.
8:30 AM: The Consumer Price Index for March from the BLS. The consensus is for 0.3% increase in CPI (up 5.2% YoY) and a 0.4% increase in core CPI (up 5.6% YoY).
2:00 PM: FOMC Minutes, Meeting of March 21-22
8:30 AM: The initial weekly unemployment claims report will be released. The consensus is for 233 thousand initial claims, up from 228 thousand last week.
8:30 AM: The Producer Price Index for March from the BLS. The consensus is for a 0.0% increase in PPI, and a 0.3% increase in core PPI.
 8:30 AM: Retail sales for March is scheduled to be released. The consensus is for a 0.4% decrease in retail sales.
 This graph shows the year-over-year change in retail sales and food service (ex-gasoline) since 1993. Retail and Food service sales, ex-gasoline, increased by 6.1% on a YoY basis in February.
 9:15 AM: The Fed will release Industrial Production and Capacity Utilization for March.
This graph shows industrial production since 1967.
The consensus is for a 0.2% increase in Industrial Production, and for Capacity Utilization to decrease to 79.0%.
10:00 AM: University of Michigan's Consumer sentiment index (Preliminary for April).
Friday, April 07, 2023
COVID Apr 7, 2023: Update on Cases, Hospitalizations and Deaths
by Calculated Risk on 4/07/2023 08:51:00 PM
 Note: Mortgage rates are from MortgageNewsDaily.com and are for top tier scenarios.
On COVID (focus on hospitalizations and deaths). Data is now weekly.
After the first few weeks, the pandemic low for weekly deaths had been the week of July 7, 2021, at 1,690 deaths.
Weekly deaths increased this week after setting a new pandemic low at 1,537 the previous week (see graph below).
| COVID Metrics | ||||
|---|---|---|---|---|
| Now | Week Ago | Goal | ||
| New Cases per Week2 | 120,820 | 136,879 | ≤35,0001 | |
| Hospitalized2 | 13,324 | 15,136 | ≤3,0001 | |
| Deaths per Week2 | 1,773 | 1,537 | ≤3501 | |
| 1my goals to stop weekly posts, 2Weekly for Cases, Currently Hospitalized, and Deaths 🚩 Increasing number weekly for Cases, Hospitalized, and Deaths ✅ Goal met. | ||||
 Click on graph for larger image.
This graph shows the weekly (columns) number of deaths reported.
For cases, the low was 82,186.
For COVID hospitalizations, the low was 9,821.
AAR: March Rail Carloads and Intermodal Decreased Year-over-year
by Calculated Risk on 4/07/2023 03:25:00 PM
From the Association of American Railroads (AAR) Rail Time Indicators. Graphs and excerpts reprinted with permission.
Rail volumes today are being negatively influenced by broader economic trends, including slowdowns in industrial output, high inventory levels at many retailers, lower port activity, and consumer spending that’s not as robust as it was during most of the last three years. Unfortunately, to date there are no clear indications that this uncertainty will dissipate in the near term.
Total U.S. freight carloads were down 1.2% in March 2023 from March 2022, their fourth year-over-year decline in the past five months. In 2023’s first quarter, total carloads were down 0.3% from last year. ... Meanwhile, U.S. intermodal volume fell 13.3% in March 2023, its 13th straight year-over-year decline and 19th in the past 20 months. In the first quarter, volume was 3.024 million containers and trailers, down 10.3% from last year and the lowest first-quarter total for intermodal since 2012.
emphasis added
 Click on graph for larger image.
This graph from the Rail Time Indicators report shows the six-week average of U.S. Carloads in 2021, 2022 and 2022:
U.S. freight railroads originated 1.164 million total carloads in March 2023, down 1.2%, or 13,794 carloads, from the same period in 2022.
For the first quarter of 2023, total carloads were down 0.3%, or 9,068 carloads, from last year.
 The second graph shows the six-week average (not monthly) of U.S. intermodal in 2021, 2022 and 2023: (using intermodal or shipping containers):
U.S. railroads also had 1.160 million intermodal originations in March 2023, down 13.3% from March 2022. ... March 2023 was only the second month since March 2017 (January 2023 was the other) in which originated carloads exceeded originated intermodal units.
...
Reasons for intermodal’s decline this year include consumer spending that is less robust than it has been; reduced port activity; too-high inventory levels at many retailers; and lower truck rates that make all-truck movements more price competitive.
1st Look at Local Housing Markets in March
by Calculated Risk on 4/07/2023 11:56:00 AM
Today, in the Calculated Risk Real Estate Newsletter: 1st Look at Local Housing Markets in March
A brief excerpt:
This is the first look at local markets in March. I’m tracking about 40 local housing markets in the US. Some of the 40 markets are states, and some are metropolitan areas. I’ll update these tables throughout the month as additional data is released.There is much more in the article. You can subscribe at https://calculatedrisk.substack.com/
Closed sales in March were mostly for contracts signed in January and February. Since 30-year fixed mortgage rates were over 6% for all of January and February - compared to 4% range the previous year - closed sales were down significantly year-over-year in March. However, the impact was probably not as severe as for closed sales in December and January (rates were the highest in October and November 2022 when contracts were signed for closing in December and January).
...
Median sales prices for single family homes were down 7.6% year-over year (YoY) in Las Vegas, down 7.5% in the Northwest, and down 6.3% YoY in Denver.
...
In March, sales in these markets were down 26.5%. In February, these same markets were down 24.3% YoY Not Seasonally Adjusted (NSA).
This is a slightly larger YoY decline NSA than in February for these early reporting markets. The March existing home sales report will show another significant YoY decline, and the 19th consecutive month with a YoY decline in sales.
This was a just a few early reporting markets. Many more local markets to come!

Wholesale Used Car Prices Increased in March, Down 2.4% Year-over-year
by Calculated Risk on 4/07/2023 11:09:00 AM
From Manheim Consulting today: Wholesale Used-Vehicle Prices See Modest Increase in March
Wholesale used-vehicle prices (on a mix, mileage, and seasonally adjusted basis) increased 1.5% in March from February. The Manheim Used Vehicle Value Index (MUVVI) rose to 238.1, down 2.4% from a year ago. March’s increase was moderated by the seasonal adjustment. The non-adjusted price change in March increased by 3.5% compared to February, moving the unadjusted average price down 2.9% year over year.
emphasis added
 Click on graph for larger image.
This index from Manheim Consulting is based on all completed sales transactions at Manheim’s U.S. auctions.
The Manheim index suggests used car prices increased in March (seasonally adjusted) and were down 2.4% year-over-year (YoY).
Comments on March Employment Report
by Calculated Risk on 4/07/2023 09:20:00 AM
The headline jobs number in the March employment report was close to expectations, however employment for the previous two months was revised down by 17,000, combined. The participation rate and employment population ratio increased, and the unemployment rate decreased to 3.5%.
Leisure and hospitality gained 72 thousand jobs in March. At the beginning of the pandemic, in March and April of 2020, leisure and hospitality lost 8.2 million jobs, and are now down 368 thousand jobs since February 2020. So, leisure and hospitality has now added back about 96% all of the jobs lost in March and April 2020.
Construction employment decreased 9 thousand and is now 280 thousand above the pre-pandemic level.
Manufacturing lost 1 thousand jobs and is now 198 thousand above the pre-pandemic level.
In March, the year-over-year employment change was 4.15 million jobs.
Prime (25 to 54 Years Old) Participation
 Since the overall participation rate is impacted by both cyclical (recession) and demographic (aging population, younger people staying in school) reasons, here is the employment-population ratio for the key working age group: 25 to 54 years old.
The 25 to 54 participation rate was unchanged in March at 83.1% from 83.1% in February, and the 25 to 54 employment population ratio increased to 80.7% from 80.5% the previous month.
Both are at the pre-pandemic levels and suggest essentially all of the prime age workers have returned to the labor force.
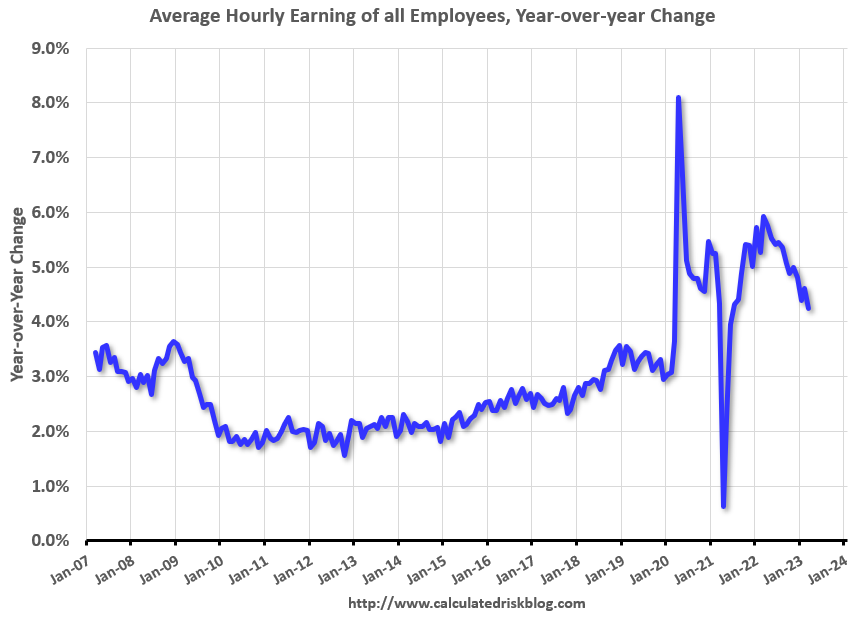
Average Hourly Wages
 The graph shows the nominal year-over-year change in "Average Hourly Earnings" for all private employees from the Current Employment Statistics (CES).
Average Hourly Wages
 The graph shows the nominal year-over-year change in "Average Hourly Earnings" for all private employees from the Current Employment Statistics (CES).
 There was a huge increase at the beginning of the pandemic as lower paid employees were let go, and then the pandemic related spike reversed a year later.
Wage growth has trended down after peaking at 5.9% YoY in March 2022 and was at 4.2% YoY in March.
Wage growth has trended down after peaking at 5.9% YoY in March 2022 and was at 4.2% YoY in March.
Wages growth was strong last year in the March through July period, so year-over-year wage growth will likely slow further over the next few months.
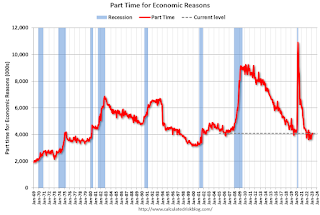
Part Time for Economic Reasons
 From the BLS report:
These workers are included in the alternate measure of labor underutilization (U-6) that decreased to 6.7% from 6.8% in the previous month. This is down from the record high in April 22.9% and up from the lowest level on record (seasonally adjusted) in December 2022 (6.5%). (This series started in 1994). This measure is below the level in February 2020 (pre-pandemic).
Unemployed over 26 Weeks
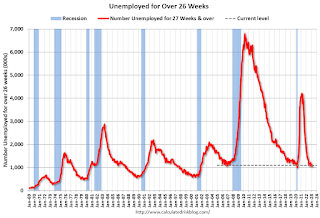 This graph shows the number of workers unemployed for 27 weeks or more.
According to the BLS, there are 1.104 million workers who have been unemployed for more than 26 weeks and still want a job, up from 1.057 million the previous month.
This is at pre-pandemic levels.
Summary:
The headline monthly jobs number was close to expectations; however, employment for the previous two months was revised down by 17,000, combined. The headline unemployment rate decreased to 3.5%.
Part Time for Economic Reasons
 From the BLS report:
"The number of persons employed part time for economic reasons was essentially unchanged at 4.1 million in March. These individuals, who would have preferred full- time employment, were working part time because their hours had been reduced or they were unable to find full-time jobs."The number of persons working part time for economic reasons increased in March to 4.102 million from 4.067 million in February. This is at pre-recession levels.
These workers are included in the alternate measure of labor underutilization (U-6) that decreased to 6.7% from 6.8% in the previous month. This is down from the record high in April 22.9% and up from the lowest level on record (seasonally adjusted) in December 2022 (6.5%). (This series started in 1994). This measure is below the level in February 2020 (pre-pandemic).
Unemployed over 26 Weeks
 This graph shows the number of workers unemployed for 27 weeks or more.
 According to the BLS, there are 1.104 million workers who have been unemployed for more than 26 weeks and still want a job, up from 1.057 million the previous month.
This is at pre-pandemic levels.
Summary:
The headline monthly jobs number was close to expectations; however, employment for the previous two months was revised down by 17,000, combined. The headline unemployment rate decreased to 3.5%.
Overall, this was a solid employment report.
March Employment Report: 236 thousand Jobs, 3.5% Unemployment Rate
by Calculated Risk on 4/07/2023 08:41:00 AM
From the BLS:
Total nonfarm payroll employment rose by 236,000 in March, and the unemployment rate changed little at 3.5 percent, the U.S. Bureau of Labor Statistics reported today. Employment continued to trend up in leisure and hospitality, government, professional and business services, and health care.
...
The change in total nonfarm payroll employment for January was revised down by 32,000, from +504,000 to +472,000, and the change for February was revised up by 15,000, from +311,000 to +326,000. With these revisions, employment in January and February combined is 17,000 lower than previously reported.
emphasis added
 Click on graph for larger image.
The first graph shows the jobs added per month since January 2021.
Total payrolls increased by 236 thousand in March. Private payrolls increased by 189 thousand, and public payrolls increased 47 thousand.
Payrolls for January and February were revised down 17 thousand, combined.
Payrolls for January and February were revised down 17 thousand, combined.
 The second graph shows the year-over-year change in total non-farm employment since 1968.
In March, the year-over-year change was 4.15 million jobs. Employment was up significantly year-over-year.
The third graph shows the employment population ratio and the participation rate.
 The Labor Force Participation Rate increased to 62.6% in March, from 62.5% in February. This is the percentage of the working age population in the labor force.
 The Employment-Population ratio increased to 60.4% from 60.2% (blue line).
I'll post the 25 to 54 age group employment-population ratio graph later.
 The fourth graph shows the unemployment rate.
 The unemployment rate decreased in March to 3.5% from 3.6% in February.
This was close to consensus expectations; however, January and February payrolls were revised down by 17,000 combined.
Thursday, April 06, 2023
Friday: Employment Report
by Calculated Risk on 4/06/2023 09:33:00 PM
 Note: Mortgage rates are from MortgageNewsDaily.com and are for top tier scenarios.
Friday:
• At 8:30 AM ET, Employment Report for March. The consensus is for 240,000 jobs added, and for the unemployment rate to be unchanged at 3.6%.
March Employment Preview
by Calculated Risk on 4/06/2023 04:29:00 PM
On Friday at 8:30 AM ET, the BLS will release the employment report for March. The consensus is for 240,000 jobs added, and for the unemployment rate to be unchanged at 3.6%.
From BofA economists:
"For the March employment report, we forecast a 265k increase in nonfarm payrolls. ... Weather is the main reason why we expect the pace of hiring to have moderated slightly in March. January and February were both unseasonably warm with limited snowfall, which according to estimates from the San Francisco Fed boosted growth in payrolls in both months. Climate data for March, however, is much more in line with seasonal norms. Therefore, we don’t expect to see the same weather boost. ... we expect the unemployment rate to fall by a tenth to 3.5%. "From Goldman Sachs:
"We estimate nonfarm payrolls rose 260k in March (mom sa) ... We estimate the unemployment rate was unchanged at 3.6%."• ADP Report: The ADP employment report showed 145,000 private sector jobs were added in March. This suggests job gains below consensus expectations, however, in general, ADP hasn't been very useful in forecasting the BLS report.
• ISM Surveys: Note that the ISM services are diffusion indexes based on the number of firms hiring (not the number of hires). The ISM® manufacturing employment index decreased in March to 46.9%, down from 49.1% last month. This would suggest about 35,000 jobs lost in manufacturing. The ADP report indicated 30,000 manufacturing jobs lost in March.
The ISM® services employment index decreased in March to 51.3%, from 54.0% last month. This would suggest service employment increased 110,000 in March.
Combined, the ISM surveys suggest 75,000 jobs added in March (well below the consensus forecast).
• Unemployment Claims: The weekly claims report showed an increase in the number of initial unemployment claims during the reference week (includes the 12th of the month) from 217,000 in February to 247,000 in March. This would usually suggest more layoffs in March than in February.
• COVID: As far as the pandemic, the number of weekly cases during the reference week in March was around 165,000, down from 263,000 in February.
• Weather: In January and February, the San Francisco Fed estimated that weather adjusted employment gains added 150+ thousand to the employment reports, and there should be some payback in March.
• Conclusion: a 240K report would be solid given the various indicators suggesting a slowdown in the economy. Some of the usual indicators - like the ISM report and the unemployment claims - suggest a sharp slowdown in job growth in March. I'll take the under this month.
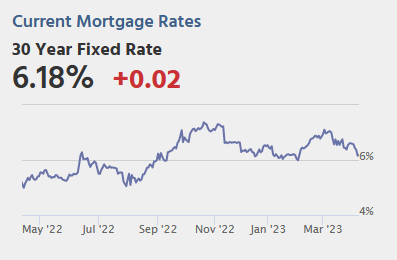
Mortgage Rate Update
by Calculated Risk on 4/06/2023 03:04:00 PM
Today, in the Calculated Risk Real Estate Newsletter: Mortgage Rate Update
Excerpt:
Mortgage News Daily reports that the most prevalent 30-year fixed rate is now at 6.18% for top tier scenarios. Usually there is a fairly steady spread between the ten-year Treasury yield and 30-year mortgage rates, although - as housing economist Tom Lawler explained in Mortgage/Treasury Spreads, Part I and Part II - the spread has widened due to several factors including volatility and pre-payment speeds.
With the ten-year yield at 3.3%, and based on an historical relationship, 30-year rates would currently be around 5.0%. So, mortgage rates are higher than expected based on the ten-year yield - for reasons Lawler explained
The graph shows the relationship between the monthly 10-year Treasury Yield and 30-year mortgage rates from the Freddie Mac survey. Note that the red dots are the last 12 months of data.

There is much more in the article. You can subscribe at https://calculatedrisk.substack.com/


