 RSS Feed
 by Calculated Risk on 4/09/2023 06:34:00 PM
Sunday, April 09, 2023
Sunday Night Futures
Weekend:
• Schedule for Week of April 9, 2023
Monday:
• No major economic releases scheduled.
From CNBC: Pre-Market Data and Bloomberg futures S&P 500 are up 8 and DOW futures are up 50 (fair value).
Oil prices were up over the last week with WTI futures at $81.02 per barrel and Brent at $85.45 per barrel. A year ago, WTI was at $98, and Brent was at $101 - so WTI oil prices are down about 17% year-over-year.
Here is a graph from Gasbuddy.com for nationwide gasoline prices. Nationally prices are at $3.57 per gallon. A year ago, prices were at $4.09 per gallon, so gasoline prices are down $0.52 per gallon year-over-year.
Q1 GDP Tracking: Around 2%
by Calculated Risk on 4/09/2023 12:51:00 PM
From BofA:
On net, since the last weekly publication, our 1Q US GDP growth tracking estimate rose from 0.8% q/q saar to 1.6% q/q saar [Apr 7th estimate]From Goldman:
emphasis added
[W]e lowered our Q1 GDP tracking estimate by 0.3pp to +2.3% (qoq ar)). [Apr 5th estimate]And from the Altanta Fed: GDPNow
The GDPNow model estimate for real GDP growth (seasonally adjusted annual rate) in the first quarter of 2023 is 1.5 percent on April 5, down from 1.7 percent on April 3. [Apr 5th estimate]
Second Home Market: South Lake Tahoe in March
by Calculated Risk on 4/09/2023 08:11:00 AM
With the pandemic, there was a surge in 2nd home buying.
I'm looking at data for some second home markets - and I'm tracking those markets to see if there is an impact from lending changes, rising mortgage rates or the easing of the pandemic.
This graph is for South Lake Tahoe since 2004 through March 2023, and shows inventory (blue), and the year-over-year (YoY) change in the median price (12-month average).
Note: The median price is a 12-month average, and is distorted by the mix, but this is the available data.
 Click on graph for larger image.
Following the housing bubble, prices declined for several years in South Lake Tahoe, with the median price falling about 50% from the bubble peak.
Currently inventory is still very low, and only up slightly from the record low set in February 2022.
Prices are down 0.4% YoY, even with inventory at historically low levels.
It is possible the massive snow storms have limited listings in the Tahoe market this year.
It is possible the massive snow storms have limited listings in the Tahoe market this year.
Saturday, April 08, 2023
Real Estate Newsletter Articles this Week: "Comparing the Current Housing Cycle to the 1980 Period"
by Calculated Risk on 4/08/2023 02:11:00 PM
At the Calculated Risk Real Estate Newsletter this week:
• 1st Look at Local Housing Markets in March
• Update: Comparing the Current Housing Cycle to the 1980 Period
• Moody's: Multifamily Demand "Softened notably over the past few quarters"
• Black Knight Mortgage Monitor: Home Prices Increased Slightly in February; Prices Up 1.9% YoY
• Mortgage Rate Update
This is usually published 4 to 6 times a week and provides more in-depth analysis of the housing market.
You can subscribe at https://calculatedrisk.substack.com/
Most content is available for free (and no Ads), but please subscribe!
Schedule for Week of April 9, 2023
by Calculated Risk on 4/08/2023 08:11:00 AM
The key reports this week are March CPI and retail sales.
For manufacturing, the March Industrial Production report will be released this week.
No major economic releases scheduled.
6:00 AM ET: NFIB Small Business Optimism Index for March.
7:00 AM ET: The Mortgage Bankers Association (MBA) will release the results for the mortgage purchase applications index.
8:30 AM: The Consumer Price Index for March from the BLS. The consensus is for 0.3% increase in CPI (up 5.2% YoY) and a 0.4% increase in core CPI (up 5.6% YoY).
2:00 PM: FOMC Minutes, Meeting of March 21-22
8:30 AM: The initial weekly unemployment claims report will be released. The consensus is for 233 thousand initial claims, up from 228 thousand last week.
8:30 AM: The Producer Price Index for March from the BLS. The consensus is for a 0.0% increase in PPI, and a 0.3% increase in core PPI.
 8:30 AM: Retail sales for March is scheduled to be released. The consensus is for a 0.4% decrease in retail sales.
 This graph shows the year-over-year change in retail sales and food service (ex-gasoline) since 1993. Retail and Food service sales, ex-gasoline, increased by 6.1% on a YoY basis in February.
 9:15 AM: The Fed will release Industrial Production and Capacity Utilization for March.
This graph shows industrial production since 1967.
The consensus is for a 0.2% increase in Industrial Production, and for Capacity Utilization to decrease to 79.0%.
10:00 AM: University of Michigan's Consumer sentiment index (Preliminary for April).
Friday, April 07, 2023
COVID Apr 7, 2023: Update on Cases, Hospitalizations and Deaths
by Calculated Risk on 4/07/2023 08:51:00 PM
 Note: Mortgage rates are from MortgageNewsDaily.com and are for top tier scenarios.
On COVID (focus on hospitalizations and deaths). Data is now weekly.
After the first few weeks, the pandemic low for weekly deaths had been the week of July 7, 2021, at 1,690 deaths.
Weekly deaths increased this week after setting a new pandemic low at 1,537 the previous week (see graph below).
| COVID Metrics | ||||
|---|---|---|---|---|
| Now | Week Ago | Goal | ||
| New Cases per Week2 | 120,820 | 136,879 | ≤35,0001 | |
| Hospitalized2 | 13,324 | 15,136 | ≤3,0001 | |
| Deaths per Week2 | 1,773 | 1,537 | ≤3501 | |
| 1my goals to stop weekly posts, 2Weekly for Cases, Currently Hospitalized, and Deaths 🚩 Increasing number weekly for Cases, Hospitalized, and Deaths ✅ Goal met. | ||||
 Click on graph for larger image.
This graph shows the weekly (columns) number of deaths reported.
For cases, the low was 82,186.
For COVID hospitalizations, the low was 9,821.
AAR: March Rail Carloads and Intermodal Decreased Year-over-year
by Calculated Risk on 4/07/2023 03:25:00 PM
From the Association of American Railroads (AAR) Rail Time Indicators. Graphs and excerpts reprinted with permission.
Rail volumes today are being negatively influenced by broader economic trends, including slowdowns in industrial output, high inventory levels at many retailers, lower port activity, and consumer spending that’s not as robust as it was during most of the last three years. Unfortunately, to date there are no clear indications that this uncertainty will dissipate in the near term.
Total U.S. freight carloads were down 1.2% in March 2023 from March 2022, their fourth year-over-year decline in the past five months. In 2023’s first quarter, total carloads were down 0.3% from last year. ... Meanwhile, U.S. intermodal volume fell 13.3% in March 2023, its 13th straight year-over-year decline and 19th in the past 20 months. In the first quarter, volume was 3.024 million containers and trailers, down 10.3% from last year and the lowest first-quarter total for intermodal since 2012.
emphasis added
 Click on graph for larger image.
This graph from the Rail Time Indicators report shows the six-week average of U.S. Carloads in 2021, 2022 and 2022:
U.S. freight railroads originated 1.164 million total carloads in March 2023, down 1.2%, or 13,794 carloads, from the same period in 2022.
For the first quarter of 2023, total carloads were down 0.3%, or 9,068 carloads, from last year.
 The second graph shows the six-week average (not monthly) of U.S. intermodal in 2021, 2022 and 2023: (using intermodal or shipping containers):
U.S. railroads also had 1.160 million intermodal originations in March 2023, down 13.3% from March 2022. ... March 2023 was only the second month since March 2017 (January 2023 was the other) in which originated carloads exceeded originated intermodal units.
...
Reasons for intermodal’s decline this year include consumer spending that is less robust than it has been; reduced port activity; too-high inventory levels at many retailers; and lower truck rates that make all-truck movements more price competitive.
1st Look at Local Housing Markets in March
by Calculated Risk on 4/07/2023 11:56:00 AM
Today, in the Calculated Risk Real Estate Newsletter: 1st Look at Local Housing Markets in March
A brief excerpt:
This is the first look at local markets in March. I’m tracking about 40 local housing markets in the US. Some of the 40 markets are states, and some are metropolitan areas. I’ll update these tables throughout the month as additional data is released.There is much more in the article. You can subscribe at https://calculatedrisk.substack.com/
Closed sales in March were mostly for contracts signed in January and February. Since 30-year fixed mortgage rates were over 6% for all of January and February - compared to 4% range the previous year - closed sales were down significantly year-over-year in March. However, the impact was probably not as severe as for closed sales in December and January (rates were the highest in October and November 2022 when contracts were signed for closing in December and January).
...
Median sales prices for single family homes were down 7.6% year-over year (YoY) in Las Vegas, down 7.5% in the Northwest, and down 6.3% YoY in Denver.
...
In March, sales in these markets were down 26.5%. In February, these same markets were down 24.3% YoY Not Seasonally Adjusted (NSA).
This is a slightly larger YoY decline NSA than in February for these early reporting markets. The March existing home sales report will show another significant YoY decline, and the 19th consecutive month with a YoY decline in sales.
This was a just a few early reporting markets. Many more local markets to come!

Wholesale Used Car Prices Increased in March, Down 2.4% Year-over-year
by Calculated Risk on 4/07/2023 11:09:00 AM
From Manheim Consulting today: Wholesale Used-Vehicle Prices See Modest Increase in March
Wholesale used-vehicle prices (on a mix, mileage, and seasonally adjusted basis) increased 1.5% in March from February. The Manheim Used Vehicle Value Index (MUVVI) rose to 238.1, down 2.4% from a year ago. March’s increase was moderated by the seasonal adjustment. The non-adjusted price change in March increased by 3.5% compared to February, moving the unadjusted average price down 2.9% year over year.
emphasis added
 Click on graph for larger image.
This index from Manheim Consulting is based on all completed sales transactions at Manheim’s U.S. auctions.
The Manheim index suggests used car prices increased in March (seasonally adjusted) and were down 2.4% year-over-year (YoY).
Comments on March Employment Report
by Calculated Risk on 4/07/2023 09:20:00 AM
The headline jobs number in the March employment report was close to expectations, however employment for the previous two months was revised down by 17,000, combined. The participation rate and employment population ratio increased, and the unemployment rate decreased to 3.5%.
Leisure and hospitality gained 72 thousand jobs in March. At the beginning of the pandemic, in March and April of 2020, leisure and hospitality lost 8.2 million jobs, and are now down 368 thousand jobs since February 2020. So, leisure and hospitality has now added back about 96% all of the jobs lost in March and April 2020.
Construction employment decreased 9 thousand and is now 280 thousand above the pre-pandemic level.
Manufacturing lost 1 thousand jobs and is now 198 thousand above the pre-pandemic level.
In March, the year-over-year employment change was 4.15 million jobs.
Prime (25 to 54 Years Old) Participation
 Since the overall participation rate is impacted by both cyclical (recession) and demographic (aging population, younger people staying in school) reasons, here is the employment-population ratio for the key working age group: 25 to 54 years old.
The 25 to 54 participation rate was unchanged in March at 83.1% from 83.1% in February, and the 25 to 54 employment population ratio increased to 80.7% from 80.5% the previous month.
Both are at the pre-pandemic levels and suggest essentially all of the prime age workers have returned to the labor force.
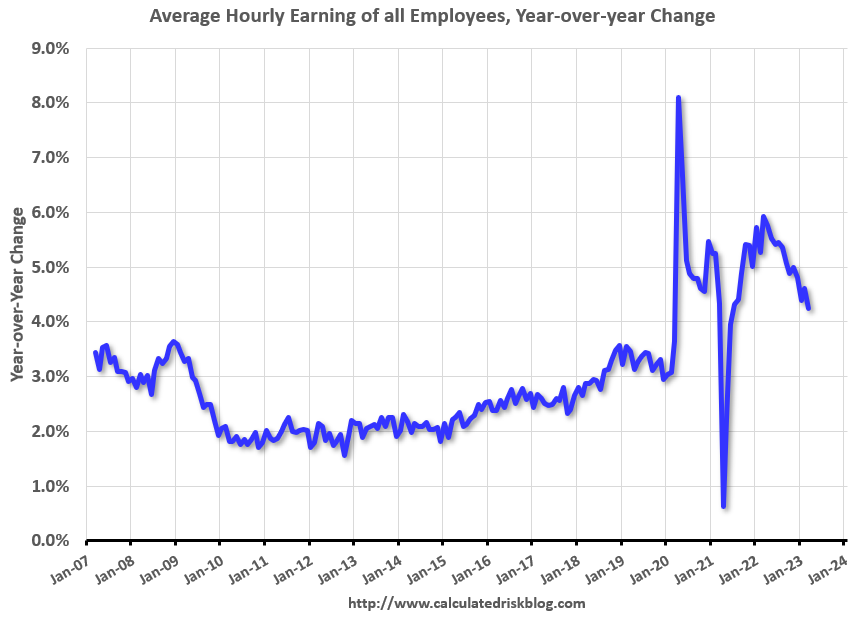
Average Hourly Wages
 The graph shows the nominal year-over-year change in "Average Hourly Earnings" for all private employees from the Current Employment Statistics (CES).
Average Hourly Wages
 The graph shows the nominal year-over-year change in "Average Hourly Earnings" for all private employees from the Current Employment Statistics (CES).
 There was a huge increase at the beginning of the pandemic as lower paid employees were let go, and then the pandemic related spike reversed a year later.
Wage growth has trended down after peaking at 5.9% YoY in March 2022 and was at 4.2% YoY in March.
Wage growth has trended down after peaking at 5.9% YoY in March 2022 and was at 4.2% YoY in March.
Wages growth was strong last year in the March through July period, so year-over-year wage growth will likely slow further over the next few months.
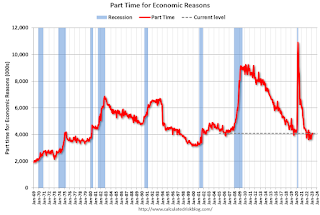
Part Time for Economic Reasons
 From the BLS report:
These workers are included in the alternate measure of labor underutilization (U-6) that decreased to 6.7% from 6.8% in the previous month. This is down from the record high in April 22.9% and up from the lowest level on record (seasonally adjusted) in December 2022 (6.5%). (This series started in 1994). This measure is below the level in February 2020 (pre-pandemic).
Unemployed over 26 Weeks
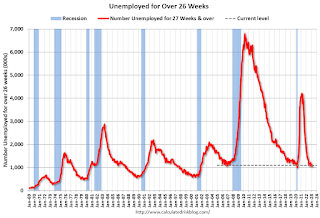 This graph shows the number of workers unemployed for 27 weeks or more.
According to the BLS, there are 1.104 million workers who have been unemployed for more than 26 weeks and still want a job, up from 1.057 million the previous month.
This is at pre-pandemic levels.
Summary:
The headline monthly jobs number was close to expectations; however, employment for the previous two months was revised down by 17,000, combined. The headline unemployment rate decreased to 3.5%.
Part Time for Economic Reasons
 From the BLS report:
"The number of persons employed part time for economic reasons was essentially unchanged at 4.1 million in March. These individuals, who would have preferred full- time employment, were working part time because their hours had been reduced or they were unable to find full-time jobs."The number of persons working part time for economic reasons increased in March to 4.102 million from 4.067 million in February. This is at pre-recession levels.
These workers are included in the alternate measure of labor underutilization (U-6) that decreased to 6.7% from 6.8% in the previous month. This is down from the record high in April 22.9% and up from the lowest level on record (seasonally adjusted) in December 2022 (6.5%). (This series started in 1994). This measure is below the level in February 2020 (pre-pandemic).
Unemployed over 26 Weeks
 This graph shows the number of workers unemployed for 27 weeks or more.
 According to the BLS, there are 1.104 million workers who have been unemployed for more than 26 weeks and still want a job, up from 1.057 million the previous month.
This is at pre-pandemic levels.
Summary:
The headline monthly jobs number was close to expectations; however, employment for the previous two months was revised down by 17,000, combined. The headline unemployment rate decreased to 3.5%.
Overall, this was a solid employment report.


