 RSS Feed
 by Calculated Risk on 4/12/2023 07:00:00 AM
Wednesday, April 12, 2023
MBA: Mortgage Applications Increased in Weekly Survey
From the MBA: Mortgage Applications Increase in Latest MBA Weekly Survey
Mortgage applications increased 5.3 percent from one week earlier, according to data from the Mortgage Bankers Association’s (MBA) Weekly Mortgage Applications Survey for the week ending April 7, 2023.
The Market Composite Index, a measure of mortgage loan application volume, increased 5.3 percent on a seasonally adjusted basis from one week earlier. On an unadjusted basis, the Index increased 6 percent compared with the previous week. The Refinance Index increased 0.1 percent from the previous week and was 57 percent lower than the same week one year ago. The seasonally adjusted Purchase Index increased 8 percent from one week earlier. The unadjusted Purchase Index increased 9 percent compared with the previous week and was 31 percent lower than the same week one year ago.
“Incoming data last week showed that the job market is beginning to slow, which led to the 30-year fixed rate decreasing to 6.30 percent – the lowest level in two months,” said Mike Fratantoni, MBA’s SVP and Chief Economist. “Prospective homebuyers this year have been quite sensitive to any drop in mortgage rates, and that played out last week with purchase applications increasing by 8 percent. Refinance application volume was a mixed bag with total volume essentially flat, conventional volume down for the week, but VA refinance volume increasing. The level of refinance activity remains almost 60 percent below last year, as most homeowners are currently locked in at much lower rates.”
..
The average contract interest rate for 30-year fixed-rate mortgages with conforming loan balances ($726,200 or less) decreased to 6.30 percent from 6.40 percent, with points decreasing to 0.55 from 0.59 (including the origination fee) for 80 percent loan-to-value ratio (LTV) loans.
emphasis added
 Click on graph for larger image.
The first graph shows the MBA mortgage purchase index.
According to the MBA, purchase activity is down 31% year-over-year unadjusted.
Red is a four-week average (blue is weekly).

The second graph shows the refinance index since 1990.
With higher mortgage rates, the refinance index declined sharply in 2022.
Tuesday, April 11, 2023
Wednesday: CPI, FOMC Minutes
by Calculated Risk on 4/11/2023 09:06:00 PM
 Note: Mortgage rates are from MortgageNewsDaily.com and are for top tier scenarios.
Wednesday:
• At 7:00 AM ET, The Mortgage Bankers Association (MBA) will release the results for the mortgage purchase applications index.
• At 8:30 AM, The Consumer Price Index for March from the BLS. The consensus is for 0.3% increase in CPI (up 5.2% YoY) and a 0.4% increase in core CPI (up 5.6% YoY).
• At 2:00 PM, FOMC Minutes, Meeting of March 21-22
The Top Ten Job Streaks: Current Streak is in 9th Place
by Calculated Risk on 4/11/2023 01:28:00 PM
For fun:
Through March 2023, the employment report indicated positive job growth for 27 consecutive months, putting the current streak in 9th place of the longest job streaks in US history (since 1939).
The Federal Reserve is projecting significant job losses later this year, and it seems likely the current streak will end soon.
| Headline Jobs, Top 10 Streaks | |
|---|---|
| Year Ended | Streak, Months |
| 2019 | 100 |
| 1990 | 48 |
| 2007 | 46 |
| 1979 | 45 |
| 1943 | 33 |
| 1986 | 33 |
| 2000 | 33 |
| 1967 | 29 |
| 20231 | 27 |
| 1995 | 25 |
| 1Currrent Streak | |
2nd Look at Local Housing Markets in March
by Calculated Risk on 4/11/2023 10:53:00 AM
Today, in the Calculated Risk Real Estate Newsletter: 2nd Look at Local Housing Markets in March
A brief excerpt:
This is the second look at local markets in March. I’m tracking about 40 local housing markets in the US. Some of the 40 markets are states, and some are metropolitan areas. I’ll update these tables throughout the month as additional data is released.There is much more in the article. You can subscribe at https://calculatedrisk.substack.com/
Closed sales in March were mostly for contracts signed in January and February. Since 30-year fixed mortgage rates were over 6% for all of January and February - compared to 4% range the previous year - closed sales were down significantly year-over-year in March. However, the impact was probably not as severe as for closed sales in December and January (rates were the highest in October and November 2022 when contracts were signed for closing in December and January)..
Median sales prices for single family homes were down 2.2% year-over year (YoY) in northeast Florida (Jacksonville), and unchanged YoY in Georgia.
...
In March, sales in these markets were down 21.0%. In February, these same markets were down 21.9% YoY Not Seasonally Adjusted (NSA).
This is a similar YoY decline NSA as in February for these markets. The March existing home sales report will show another significant YoY decline, and the 19th consecutive month with a YoY decline in sales.
Many more local markets to come!

More Employment Graphs: Duration of Unemployment, Unemployment by Education, Diffusion Indexes
by Calculated Risk on 4/11/2023 09:25:00 AM
A few more employment graphs ...
 Click on graph for larger image.
This graph shows the duration of unemployment as a percent of the civilian labor force. The graph shows the number of unemployed in four categories: less than 5 week, 6 to 14 weeks, 15 to 26 weeks, and 27 weeks or more.
The short-term categories peaked at over 9% of the labor force at the onset of the pandemic.
The duration of unemployment was much shorter during the pandemic than during the housing bust / financial crisis. In general, all categories are close to normal levels.
Unemployment by Education
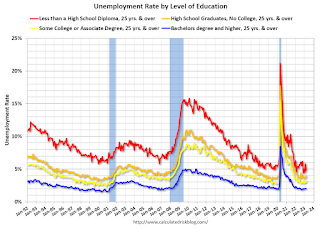 This graph shows the unemployment rate by four levels of education (all groups are 25 years and older).
Unfortunately, this data only goes back to 1992 and includes only three recessions (the stock / tech bust in 2001, and the housing bust/financial crisis, and the 2020 pandemic). Clearly education matters with regards to the unemployment rate, with the lowest rate for college graduates at 2.0% in March, and highest for those without a high school degree at 4.8% in March.
All four groups were generally trending down prior to the pandemic. And all are close to pre-pandemic levels now.
Note: This says nothing about the quality of jobs - as an example, a college graduate working at minimum wage would be considered "employed".
Diffusion Indexes
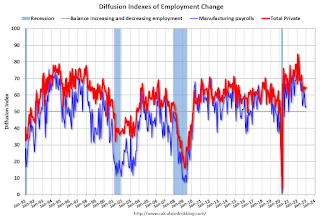 The BLS diffusion index for total private employment was at 60.2 in March, up from 57.4 in February. A solid reading.
For manufacturing, the diffusion index was at 56.3, up from 47.9 in February.
Think of this as a measure of how widespread job gains are across industries. The further from 50 (above or below), the more widespread the job losses or gains reported by the BLS. Above 60 is very good. From the BLS:
 This graph shows the unemployment rate by four levels of education (all groups are 25 years and older).
Unfortunately, this data only goes back to 1992 and includes only three recessions (the stock / tech bust in 2001, and the housing bust/financial crisis, and the 2020 pandemic). Clearly education matters with regards to the unemployment rate, with the lowest rate for college graduates at 2.0% in March, and highest for those without a high school degree at 4.8% in March.
All four groups were generally trending down prior to the pandemic. And all are close to pre-pandemic levels now.
Note: This says nothing about the quality of jobs - as an example, a college graduate working at minimum wage would be considered "employed".
 The BLS diffusion index for total private employment was at 60.2 in March, up from 57.4 in February. A solid reading.
For manufacturing, the diffusion index was at 56.3, up from 47.9 in February.
Think of this as a measure of how widespread job gains are across industries. The further from 50 (above or below), the more widespread the job losses or gains reported by the BLS. Above 60 is very good. From the BLS:
Figures are the percent of industries with employment increasing plus one-half of the industries with unchanged employment, where 50 percent indicates an equal balance between industries with increasing and decreasing employment.Overall private job growth was widespread in March.
Monday, April 10, 2023
"Mortgage Rates Have Quickly Erased Last Week's Drop"
by Calculated Risk on 4/10/2023 09:09:00 PM
 From Matthew Graham at Mortgage News Daily: Mortgage Rates Have Quickly Erased Last Week's Drop
There was no new data behind today's move. Truly, it was as simple as the mortgage market getting caught up with the bond market (bonds ultimately dictate rate momentum).Tuesday:
The next big flashpoint will be Wednesday morning's Consumer Price Index (CPI)--the most important monthly inflation report, and oftentimes more important than the jobs report ... While there's no way to know if the report will be good or bad for rates, nothing else on this week's calendar has the potential to cause as much of a reaction. [30 year fixed 6.50%]
emphasis added
• At 6:00 AM ET, NFIB Small Business Optimism Index for March.
Leading Index for Commercial Real Estate Decreased in March
by Calculated Risk on 4/10/2023 03:01:00 PM
From Dodge Data Analytics: Dodge Momentum Index Drops in March
The Dodge Momentum Index (DMI), issued by Dodge Construction Network, slipped 8.6% in March to 183.7 (2000=100) from the revised February reading of 201.0. In March, the commercial component of the DMI fell 6.6%, and the institutional component decreased 12.9%.
“We are predicting the Dodge Momentum Index to work its way back to historical norms throughout 2023, concurrent with weaker economic conditions,” stated Sarah Martin, associate director of forecasting for Dodge Construction Network. “Lending standards for small banks in particular have substantially tightened as banking insecurity intensifies. As a result, owners and developers are more likely to pullback in the short-term, which would further contract the DMI as we continue into the year.”
Commercial planning in March was driven down by less projects in the office and warehouse sectors, decreasing 29% and 11%, respectively. Institutional planning weakened more substantially, as healthcare fell 17%, education dipped 6%, and amusement planning activity dropped 14%. On the upside, however, a steady flow of research and development laboratories entered the queue, supporting the otherwise weakening sector. Year over year, the DMI remains 24% higher than in March 2022. The commercial component was up 37%, and the institutional component was 2% higher.
...
The DMI is a monthly measure of the initial report for nonresidential building projects in planning, shown to lead construction spending for nonresidential buildings by a full year.
emphasis added
 Click on graph for larger image.
This graph shows the Dodge Momentum Index since 2002. The index was at 183.7 in March, down from 201.0 the previous month.
According to Dodge, this index leads "construction spending for nonresidential buildings by a full year". This index suggests a solid pickup in commercial real estate construction in 2023. but a slowdown towards the end of 2023 or in 2024.
As Ms. Martin previously noted, commercial construction is a lagging economic indicator.
A Few Comments on Commercial Real Estate
by Calculated Risk on 4/10/2023 10:34:00 AM
Today, in the Calculated Risk Real Estate Newsletter: A Few Comments on Commercial Real Estate
A brief excerpt:
The focus of this newsletter is residential real estate, although I follow several commercial real estate (CRE) sectors on my blog. There have been numerous warnings recently about a potential CRE lending crisis and I’d like to add a few comments.There is much more in the article. You can subscribe at https://calculatedrisk.substack.com/
First, when most people think “CRE” they think office and retail space. The concern for retail is online shopping eroding in-store buying (a long-term trend), and work-from-home (WFH) reducing the need for office space (another long-term trend that increased sharply during the pandemic but has reversed recently).
However, there are many other CRE sectors in addition to office and retail: lodging (hotels), health care, warehouses (including self-storage), manufacturing facilities, food and beverage establishments, power and communication, amusement and recreation (Disneyland!), religious, transportation and more.
Most of these other CRE sectors are fine. Of the $11.1 trillion invested in CRE since the year 2000 (according to the BEA), about 12% was in offices and 4% in malls. These are important sectors, but there is much more to CRE.
...
The office sector is concerning mostly due to the shift in the need for space with WFH increasing. However, there wasn’t the extreme overbuilding and poor underwriting that we saw in the 1980’s. This graph shows investment in offices, malls and lodging as a percent of GDP through Q4 2022.
Investment in offices (blue) was increasing prior to the pandemic, but the increase was nothing like the office building boom in the ‘80s with poor underwriting. From 1981 through 1989, office investment averaged 0.7% of GDP - about double the normal level of investment. The vacancy problem this time is related to decreased demand.

Housing April 10th Weekly Update: Inventory Increased 0.2% Week-over-week
by Calculated Risk on 4/10/2023 08:30:00 AM
Altos reports that active single-family inventory was up 0.2% week-over-week. Maybe inventory has finally bottomed seasonally.
 Click on graph for larger image.
This inventory graph is courtesy of Altos Research.
As of April 7th, inventory was at 411 thousand (7-day average), compared to 410 thousand the prior week.
Year-to-date, inventory is down 16.3%.

The red line is for 2023. The black line is for 2019. Note that inventory is up from the previous two years (the record low was in 2022), but still well below normal levels.
Inventory was up 59.1% compared to the same week in 2022 (last week it was up 62.2%), and down 50.9% compared to the same week in 2019 (last week down 50.8%).
A key will be when inventory starts increasing in 2023 - maybe this is the beginning.
Mike Simonsen discusses this data regularly on Youtube.
Sunday, April 09, 2023
Sunday Night Futures
by Calculated Risk on 4/09/2023 06:34:00 PM
Weekend:
• Schedule for Week of April 9, 2023
Monday:
• No major economic releases scheduled.
From CNBC: Pre-Market Data and Bloomberg futures S&P 500 are up 8 and DOW futures are up 50 (fair value).
Oil prices were up over the last week with WTI futures at $81.02 per barrel and Brent at $85.45 per barrel. A year ago, WTI was at $98, and Brent was at $101 - so WTI oil prices are down about 17% year-over-year.
Here is a graph from Gasbuddy.com for nationwide gasoline prices. Nationally prices are at $3.57 per gallon. A year ago, prices were at $4.09 per gallon, so gasoline prices are down $0.52 per gallon year-over-year.


