 RSS Feed
 by Calculated Risk on 4/13/2023 08:34:00 AM
Thursday, April 13, 2023
Weekly Initial Unemployment Claims increase to 239,000
The DOL reported:
In the week ending April 8, the advance figure for seasonally adjusted initial claims was 239,000, an increase of 11,000 from the previous week's unrevised level of 228,000. This is the highest level for initial claims since January 15, 2022 when it was 251,000. The 4-week moving average was 240,000, an increase of 2,250 from the previous week's unrevised average of 237,750. This is the highest level for this average since November 20, 2021 when it was 249,250.The following graph shows the 4-week moving average of weekly claims since 1971.
emphasis added
 Click on graph for larger image.
The dashed line on the graph is the current 4-week average. The four-week average of weekly unemployment claims increased to 240,000.
The previous week was unrevised.
Weekly claims were above the consensus forecast.
Wednesday, April 12, 2023
Thursday: Unemployment Claims, PPI
by Calculated Risk on 4/12/2023 08:43:00 PM
 Note: Mortgage rates are from MortgageNewsDaily.com and are for top tier scenarios.
Thursday:
• At 8:30 AM ET, The initial weekly unemployment claims report will be released. The consensus is for 233 thousand initial claims, up from 228 thousand last week.
• Also at 8:30 AM, The Producer Price Index for March from the BLS. The consensus is for a 0.0% increase in PPI, and a 0.3% increase in core PPI.
FOMC Minutes: "some additional policy firming may be appropriate"; Staff Predicts Recession
by Calculated Risk on 4/12/2023 02:08:00 PM
This meeting the FOMC "members anticipated that some additional policy firming may be appropriate", whereas at the previous meeting "all participants continued to anticipate that ongoing increases in the target range for the federal funds rate would be appropriate".
Update:
For some time, the forecast for the U.S. economy prepared by the staff had featured subdued real GDP growth for this year and some softening in the labor market. Given their assessment of the potential economic effects of the recent banking-sector developments, the staff's projection at the time of the March meeting included a mild recession starting later this year, with a recovery over the subsequent two years.From the Fed: Minutes of the Federal Open Market Committee March 21–22, 2023. Excerpt:
In their discussion of monetary policy for this meeting, members agreed that recent indicators pointed to modest growth in spending and production. They also concurred that job gains had picked up in recent months and were running at a robust pace, that the unemployment rate had remained low, and that inflation remains elevated. Members concurred that the U.S. banking system is sound and resilient. They also agreed that recent developments were likely to result in tighter credit conditions for households and businesses and to weigh on economic activity, hiring, and inflation, but that the extent of these effects was uncertain. Members also concurred that they remained highly attentive to inflation risks.
Members agreed that the Committee seeks to achieve maximum employment and inflation at the rate of 2 percent over the longer run. In support of these goals, members agreed to raise the target range for the federal funds rate to 4-3/4 to 5 percent. Members agreed that they would closely monitor incoming information and assess the implications for monetary policy. Given recent developments, members anticipated that some additional policy firming may be appropriate in order to attain a stance of monetary policy that is sufficiently restrictive to return inflation to 2 percent over time. Members concurred that, in determining the extent of future increases in the target range, they would take into account the cumulative tightening of monetary policy, the lags with which monetary policy affects economic activity and inflation, and economic and financial developments. In addition, members agreed that they would continue reducing the Federal Reserve's holdings of Treasury securities and agency debt and agency MBS, as described in its previously announced plans. All members affirmed that they remained strongly committed to returning inflation to its 2 percent objective.
emphasis added
Cleveland Fed: Median CPI increased 0.4% and Trimmed-mean CPI increased 0.2% in March
by Calculated Risk on 4/12/2023 11:23:00 AM
The Cleveland Fed released the median CPI and the trimmed-mean CPI:
According to the Federal Reserve Bank of Cleveland, the median Consumer Price Index rose 0.4% in March. The 16% trimmed-mean Consumer Price Index increased 0.2% in March. "The median CPI and 16% trimmed-mean CPI are measures of core inflation calculated by the Federal Reserve Bank of Cleveland based on data released in the Bureau of Labor Statistics’ (BLS) monthly CPI report".
 Click on graph for larger image.
This graph shows the year-over-year change for these four key measures of inflation.
On a year-over-year basis, the median CPI rose 7.1%, the trimmed-mean CPI rose 6.2%, and the CPI less food and energy rose 5.6%. Core PCE is for February and increased 4.7% year-over-year.
Note: The Cleveland Fed released the median CPI details. "Motor fuel" decreased at a 44% annualized rate in March, and "Car and truck rental" decreased at a 37% annualized rate.
Note that Owners' Equivalent Rent and Rent of Primary Residence account for 1/3 of median CPI, and these measures were up 6% annualized, down sharply from the previous months (based on relative importance in the index). This data is lagged and asking rents have softened in recent months (due to the sharp slowdown in household formation).
Remote Work and Household Formation
by Calculated Risk on 4/12/2023 10:55:00 AM
Today, in the Calculated Risk Real Estate Newsletter: Remote Work and Household Formation
A brief excerpt:
Back in September 2021, I wrote Household Formation Drives Housing DemandThere is more in the article. You can subscribe at https://calculatedrisk.substack.com/So what is driving demand for both homeownership and rentals? Household formation!Over time, housing economist Tom Lawler and I unraveled the household formation mystery. A key driver of household formation was work-from-home. And this analysis has some significant implications for the housing market and the Federal Reserve (see articles at the bottom of this note).
...
Today, economists Adam Ozimek and Eric Carlson published new research: Remote Work and Household Formation
Another important basic fact of housing markets during the pandemic is that there was a rapid expansion of household formation. As Figure 3 shows, household formation surged 2.5% in 2021, more than double the fastest pace post Great Recession.

YoY Measures of Inflation: Services, Goods and Shelter
by Calculated Risk on 4/12/2023 09:06:00 AM
Here a few measures of inflation:
The first graph is the one Fed Chair Powell has been mentioning.
 Click on graph for larger image.
This graph shows the YoY price change for Services and Services less rent of shelter through March 2023.
Services were up 7.2% YoY as of March 2023, down from 7.6% YoY in February.
Services less rent of shelter was up 6.1% YoY in March, down from 6.9% YoY in February.
Services less rent of shelter was up 6.1% YoY in March, down from 6.9% YoY in February.
Will services ex-shelter inflation be persistent, or will it follow a similar pattern as goods? This is a topic I discussed last month in Pandemic Economics, Housing and Monetary Policy: Part 2.
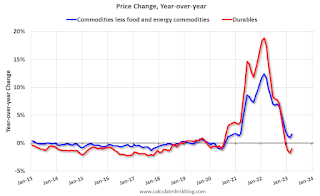 The second graph shows that goods prices started to increase year-over-year (YoY) in 2020 and accelerated in 2021 due to both strong demand and supply chain disruptions.
 The second graph shows that goods prices started to increase year-over-year (YoY) in 2020 and accelerated in 2021 due to both strong demand and supply chain disruptions.
Durables were at -1.0% YoY as of March 2023, up from -1.8% YoY in February.
Commodities less food and energy commodities were up 1.6% YoY in March, up from 1.0% YoY in February.
Commodities less food and energy commodities were up 1.6% YoY in March, up from 1.0% YoY in February.
Goods inflation was transitory.
 Here is a graph of the year-over-year change in shelter from the CPI report (through March) and housing from the PCE report (through February 2023)
Shelter was up 8.2% year-over-year in March, up from 8.1% in February. Housing (PCE) was up 8.2% YoY in February.
The BLS noted this morning: "The index for shelter was by far the largest contributor to the monthly all items increase."
BLS: CPI increased 0.1% in March; Core CPI increased 0.4%
by Calculated Risk on 4/12/2023 08:32:00 AM
The Consumer Price Index for All Urban Consumers (CPI-U) rose 0.1 percent in March on a seasonally adjusted basis, after increasing 0.4 percent in February, the U.S. Bureau of Labor Statistics reported today. Over the last 12 months, the all items index increased 5.0 percent before seasonal adjustment.CPI was lower than expected and core CPI was at expectations. I'll post a graph later today after the Cleveland Fed releases the median and trimmed-mean CPI.
The index for shelter was by far the largest contributor to the monthly all items increase. This more than offset a decline in the energy index, which decreased 3.5 percent over the month as all major energy component indexes declined. The food index was unchanged in March with the food at home index falling 0.3 percent.
The index for all items less food and energy rose 0.4 percent in March, after rising 0.5 percent in February. Indexes which increased in March include shelter, motor vehicle insurance, airline fares, household furnishings and operations, and new vehicles. The index for medical care and the index for used cars and trucks were among those that decreased over the month.
The all items index increased 5.0 percent for the 12 months ending March; this was the smallest 12-month increase since the period ending May 2021. The all items less food and energy index rose 5.6 percent over the last 12 months. The energy index decreased 6.4 percent for the 12 months ending March, and the food index increased 8.5 percent over the last year.
emphasis added
MBA: Mortgage Applications Increased in Weekly Survey
by Calculated Risk on 4/12/2023 07:00:00 AM
From the MBA: Mortgage Applications Increase in Latest MBA Weekly Survey
Mortgage applications increased 5.3 percent from one week earlier, according to data from the Mortgage Bankers Association’s (MBA) Weekly Mortgage Applications Survey for the week ending April 7, 2023.
The Market Composite Index, a measure of mortgage loan application volume, increased 5.3 percent on a seasonally adjusted basis from one week earlier. On an unadjusted basis, the Index increased 6 percent compared with the previous week. The Refinance Index increased 0.1 percent from the previous week and was 57 percent lower than the same week one year ago. The seasonally adjusted Purchase Index increased 8 percent from one week earlier. The unadjusted Purchase Index increased 9 percent compared with the previous week and was 31 percent lower than the same week one year ago.
“Incoming data last week showed that the job market is beginning to slow, which led to the 30-year fixed rate decreasing to 6.30 percent – the lowest level in two months,” said Mike Fratantoni, MBA’s SVP and Chief Economist. “Prospective homebuyers this year have been quite sensitive to any drop in mortgage rates, and that played out last week with purchase applications increasing by 8 percent. Refinance application volume was a mixed bag with total volume essentially flat, conventional volume down for the week, but VA refinance volume increasing. The level of refinance activity remains almost 60 percent below last year, as most homeowners are currently locked in at much lower rates.”
..
The average contract interest rate for 30-year fixed-rate mortgages with conforming loan balances ($726,200 or less) decreased to 6.30 percent from 6.40 percent, with points decreasing to 0.55 from 0.59 (including the origination fee) for 80 percent loan-to-value ratio (LTV) loans.
emphasis added
 Click on graph for larger image.
The first graph shows the MBA mortgage purchase index.
According to the MBA, purchase activity is down 31% year-over-year unadjusted.
Red is a four-week average (blue is weekly).

The second graph shows the refinance index since 1990.
With higher mortgage rates, the refinance index declined sharply in 2022.
Tuesday, April 11, 2023
Wednesday: CPI, FOMC Minutes
by Calculated Risk on 4/11/2023 09:06:00 PM
 Note: Mortgage rates are from MortgageNewsDaily.com and are for top tier scenarios.
Wednesday:
• At 7:00 AM ET, The Mortgage Bankers Association (MBA) will release the results for the mortgage purchase applications index.
• At 8:30 AM, The Consumer Price Index for March from the BLS. The consensus is for 0.3% increase in CPI (up 5.2% YoY) and a 0.4% increase in core CPI (up 5.6% YoY).
• At 2:00 PM, FOMC Minutes, Meeting of March 21-22
The Top Ten Job Streaks: Current Streak is in 9th Place
by Calculated Risk on 4/11/2023 01:28:00 PM
For fun:
Through March 2023, the employment report indicated positive job growth for 27 consecutive months, putting the current streak in 9th place of the longest job streaks in US history (since 1939).
The Federal Reserve is projecting significant job losses later this year, and it seems likely the current streak will end soon.
| Headline Jobs, Top 10 Streaks | |
|---|---|
| Year Ended | Streak, Months |
| 2019 | 100 |
| 1990 | 48 |
| 2007 | 46 |
| 1979 | 45 |
| 1943 | 33 |
| 1986 | 33 |
| 2000 | 33 |
| 1967 | 29 |
| 20231 | 27 |
| 1995 | 25 |
| 1Currrent Streak | |


