 RSS Feed
 by Calculated Risk on 4/16/2023 11:13:00 AM
Sunday, April 16, 2023
By Request: Public and Private Sector Payroll Jobs During Presidential Terms
Note: I used to post this monthly, but I stopped during the COVID-19 pandemic. I've received a number of requests lately to post this again, so here is another update of tracking employment during Presidential terms. We frequently use Presidential terms as time markers - we could use Speaker of the House, Fed Chair, or any other marker.
Important: There are many differences between these periods. Overall employment was smaller in the '80s, however the participation rate was increasing in the '80s (younger population and women joining the labor force), and the participation rate is generally declining now. But these graphs give an overview of employment changes.
The first graph shows the change in private sector payroll jobs from when each president took office until the end of their term(s). Presidents Carter, George H.W. Bush and Trump only served one term.
Mr. G.W. Bush (red) took office following the bursting of the stock market bubble, and left during the bursting of the housing bubble. Mr. Obama (dark blue) took office during the financial crisis and great recession. There was also a significant recession in the early '80s right after Mr. Reagan (dark red) took office.
There was a recession towards the end of President G.H.W. Bush (light purple) term, and Mr. Clinton (light blue) served for eight years without a recession. And there was a pandemic related recession in 2020.
First, here is a table for private sector jobs. The top two previous private sector terms were both under President Clinton.
| Term | Private Sector Jobs Added (000s) |
|---|---|
| Carter | 9,039 |
| Reagan 1 | 5,363 |
| Reagan 2 | 9,351 |
| GHW Bush | 1,511 |
| Clinton 1 | 10,877 |
| Clinton 2 | 10,093 |
| GW Bush 1 | -820 |
| GW Bush 2 | 447 |
| Obama 1 | 1,906 |
| Obama 2 | 9,927 |
| Trump | -2,135 |
| Biden | 11,8241 |
| 1After 26 months. | |
 Click on graph for larger image.
The first graph is for private employment only.
The employment recovery during Mr. G.W. Bush's (red) first term was sluggish, and private employment was down 820,000 jobs at the end of his first term. At the end of Mr. Bush's second term, private employment was collapsing, and there were net 373,000 private sector jobs lost during Mr. Bush's two terms.
Private sector employment increased by 9,039,000 under President Carter (dashed green), by 14,714,000 under President Reagan (dark red), 1,511,000 under President G.H.W. Bush (light purple), 20,970,000 under President Clinton (light blue), and 11,833,000 under President Obama (dark dashed blue). During Trump's term (Orange), the economy lost 2,135,000 private sector jobs.
In the first 26 months of President Biden's term (Blue), the economy has added 11,824,000 private sector jobs, as the economy recovered from the pandemic.
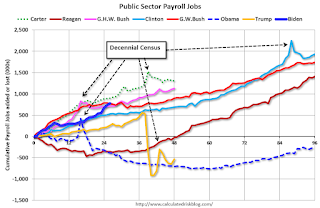 A big difference between the presidencies has been public sector employment. Note: the bumps in public sector employment due to the decennial Census in 1980, 1990, 2000, 2010 and 2020.
The public sector grew during Mr. Carter's term (up 1,304,000), during Mr. Reagan's terms (up 1,414,000), during Mr. G.H.W. Bush's term (up 1,127,000), during Mr. Clinton's terms (up 1,934,000), and during Mr. G.W. Bush's terms (up 1,744,000 jobs). However the public sector declined significantly while Mr. Obama was in office (down 271,000 jobs). During Trump's term, the economy lost 535,000 public sector jobs.
 A big difference between the presidencies has been public sector employment. Note: the bumps in public sector employment due to the decennial Census in 1980, 1990, 2000, 2010 and 2020.
 The public sector grew during Mr. Carter's term (up 1,304,000), during Mr. Reagan's terms (up 1,414,000), during Mr. G.H.W. Bush's term (up 1,127,000), during Mr. Clinton's terms (up 1,934,000), and during Mr. G.W. Bush's terms (up 1,744,000 jobs). However the public sector declined significantly while Mr. Obama was in office (down 271,000 jobs). During Trump's term, the economy lost 535,000 public sector jobs.
In the first 26 months of President Biden's term, the economy has added 776,000 public sector jobs (about 70% of public job growth has been local education).
| Term | Public Sector Jobs Added (000s) |
|---|---|
| Carter | 1,304 |
| Reagan 1 | -24 |
| Reagan 2 | 1,438 |
| GHW Bush | 1,127 |
| Clinton 1 | 692 |
| Clinton 2 | 1,242 |
| GW Bush 1 | 900 |
| GW Bush 2 | 844 |
| Obama 1 | -710 |
| Obama 2 | 447 |
| Trump | -535 |
| Biden | 7761 |
| 1After 26 months. | |
Saturday, April 15, 2023
Real Estate Newsletter Articles this Week: "Early Read on Existing Home Sales in March"
by Calculated Risk on 4/15/2023 02:11:00 PM
At the Calculated Risk Real Estate Newsletter this week:
• Lawler: Early Read on Existing Home Sales in March
• Current State of the Housing Market; Overview for mid-April
• Remote Work and Household Formation
• A Few Comments on Commercial Real Estate
• 2nd Look at Local Housing Markets in March
This is usually published 4 to 6 times a week and provides more in-depth analysis of the housing market.
You can subscribe at https://calculatedrisk.substack.com/
Most content is available for free (and no Ads), but please subscribe!
Schedule for Week of April 16, 2023
by Calculated Risk on 4/15/2023 08:11:00 AM
The key reports this week are March Housing Starts and Existing Home Sales.
8:30 AM: The New York Fed Empire State manufacturing survey for April. The consensus is for a reading of -18.0, up from -24.6.
10:00 AM: The April NAHB homebuilder survey. The consensus is for a reading of 45, up from 44. Any number below 50 indicates that more builders view sales conditions as poor than good.
 8:30 AM ET: Housing Starts for March.
 This graph shows single and multi-family housing starts since 1968.
The consensus is for 1.400 million SAAR, down from 1.450 million SAAR in February.
7:00 AM ET: The Mortgage Bankers Association (MBA) will release the results for the mortgage purchase applications index.
During the day: The AIA's Architecture Billings Index for March (a leading indicator for commercial real estate).
2:00 PM: the Federal Reserve Beige Book, an informal review by the Federal Reserve Banks of current economic conditions in their Districts.
8:30 AM: The initial weekly unemployment claims report will be released. The consensus is for 240 thousand initial claims, up from 239 thousand last week.
8:30 AM: the Philly Fed manufacturing survey for April. The consensus is for a reading of -20.0, up from -24.6.
 10:00 AM: Existing Home Sales for March from the National Association of Realtors (NAR). The consensus is for 4.50 million SAAR, down from 4.58 million.
The graph shows existing home sales from 1994 through the report last month.
Housing economist Tom Lawler expects the NAR to report sales of 4.51 million SAAR for March.
10:00 AM: State Employment and Unemployment (Monthly) for March 2023
Friday, April 14, 2023
COVID Apr 14, 2023: Update on Cases, Hospitalizations and Deaths
by Calculated Risk on 4/14/2023 09:01:00 PM
 Note: Mortgage rates are from MortgageNewsDaily.com and are for top tier scenarios.
On COVID (focus on hospitalizations and deaths). Data is now weekly.
After the first few weeks, the pandemic low for weekly deaths had been the week of July 7, 2021, at 1,690 deaths.
Weekly deaths decreased this week and set a new pandemic low of 1,327 deaths in the most recent week (see graph below).
| COVID Metrics | ||||
|---|---|---|---|---|
| Now | Week Ago | Goal | ||
| New Cases per Week2 | 101,437 | 122,632 | ≤35,0001 | |
| Hospitalized2 | 11,933 | 13,640 | ≤3,0001 | |
| Deaths per Week2 | 1,327 | 1,779 | ≤3501 | |
| 1my goals to stop weekly posts, 2Weekly for Cases, Currently Hospitalized, and Deaths 🚩 Increasing number weekly for Cases, Hospitalized, and Deaths ✅ Goal met. | ||||
 Click on graph for larger image.
This graph shows the weekly (columns) number of deaths reported.
For cases, the low was 82,186.
For COVID hospitalizations, the low was 9,821.
Lawler: Early Read on Existing Home Sales in March; 3rd Look at Local Housing Markets in March
by Calculated Risk on 4/14/2023 02:13:00 PM
Today, in the Calculated Risk Real Estate Newsletter: Lawler: Early Read on Existing Home Sales in March
A brief excerpt:
This is the third look at local markets in March. I’m tracking about 40 local housing markets in the US. Some of the 40 markets are states, and some are metropolitan areas. I’ll update these tables throughout the month as additional data is released.There is much more in the article. You can subscribe at https://calculatedrisk.substack.com/
Closed sales in March were mostly for contracts signed in January and February. Since 30-year fixed mortgage rates were over 6% for all of January and February - compared to 4% range the previous year - closed sales were down significantly year-over-year in March. However, the impact was probably not as severe as for closed sales in December and January (rates were the highest in October and November 2022 when contracts were signed for closing in December and January).
A few prices: Median sales prices in the Charlotte region were down 0.4% year-over year (YoY), up 1.9% YoY in Des Moines, and down 10.0% YoY in Sacramento.
...
In March, sales in these markets were down 21.2%. In February, these same markets were down 23.4% YoY Not Seasonally Adjusted (NSA).
This is a slightly smaller YoY decline NSA than in February for these markets. The March existing home sales report will show another significant YoY decline and will be the 19th consecutive month with a YoY decline in sales.
Many more local markets to come!

Q1 GDP Tracking: Around 2%
by Calculated Risk on 4/14/2023 01:40:00 PM
From BofA:
March industrial production was stronger than expected, along with upward revisions to February. Utilities production in March came in higher than expected at 8.4% m/m increasing our personal consumption tracking estimate for 1Q. Mining fell by 0.2% m/m. The components of support activities for mining that feed into our structures estimate were slightly higher than expected, pushing up our structures tracking estimate for 1Q. Business equipment tracking estimate came in lower than expected, thereby lowering our equipment spending tracking estimate for 1Q. Overall, this pushed up our 1Q US GDP tracking estimate from 1.5% q/q saar to 1.6% q/q saar.From Goldman:
However, the weaker inventories data took down our tracking estimate for the change in private inventories. As a result, inventories lowered our tracking estimate two-tenths to 1.4% q/q saar. [Apr 14th estimate]
emphasis added
We boosted our Q1 GDP tracking estimate by 0.1pp to +2.2% (qoq ar), reflecting stronger consumption but lower inventory investment. Our domestic final sales growth forecast stands at +3.9%. [Apr 14th estimate]And from the Altanta Fed: GDPNow
The GDPNow model estimate for real GDP growth (seasonally adjusted annual rate) in the first quarter of 2023 is 2.5 percent on April 14, up from 2.2 percent on April 10. After recent releases the US Bureau of Labor Statistics, the US Census Bureau, the US Department of the Treasury's Bureau of the Fiscal Service, and the Federal Reserve Board of Governors, the nowcasts of first-quarter real gross private domestic investment growth and first-quarter real government spending growth increased from -6.5 percent and 2.2 percent, respectively, to -5.9 percent and 2.6 percent. [Apr 14th estimate]
Industrial Production Increased 0.4% in March
by Calculated Risk on 4/14/2023 09:23:00 AM
From the Fed: Industrial Production and Capacity Utilization
Industrial production rose 0.4 percent in March and was little changed in the first quarter, increasing at an annual rate of 0.2 percent. In March, manufacturing and mining output each fell 0.5 percent. The index for utilities jumped 8.4 percent, as the return to more seasonal weather after a mild February boosted the demand for heating. At 103.0 percent of its 2017 average, total industrial production in March was 0.5 percent above its year-earlier level. Capacity utilization moved up to 79.8 percent in March, a rate that is 0.1 percentage point above its long-run (1972–2022) average.
emphasis added
 Click on graph for larger image.
This graph shows Capacity Utilization. This series is up from the record low set in April 2020, and above the level in February 2020 (pre-pandemic).
Capacity utilization at 79.8% is 0.1% above the average from 1972 to 2022. This was above consensus expectations.
Note: y-axis doesn't start at zero to better show the change.
 The second graph shows industrial production since 1967.
Industrial production was increased in March to 103.0. This is above the pre-pandemic level.
Industrial production was above consensus expectations and previous months were revised up.
Retail Sales Decreased 1.0% in March
by Calculated Risk on 4/14/2023 08:39:00 AM
On a monthly basis, retail sales were down 1.0% from February to March (seasonally adjusted), and sales were up 2.9 percent from March 2022.
From the Census Bureau report:
Advance estimates of U.S. retail and food services sales for March 2023, adjusted for seasonal variation and holiday and trading-day differences, but not for price changes, were $691.7 billion, down 1.0 percent from the previous month, but up 2.9 percent above March 2022. ... The January 2023 to February 2023 percent change was revised from down 0.4 percent to down 0.2 percent.
emphasis added
 Click on graph for larger image.
This graph shows retail sales since 1992. This is monthly retail sales and food service, seasonally adjusted (total and ex-gasoline).
Retail sales ex-gasoline were unchanged in March.
The second graph shows the year-over-year change in retail sales and food service (ex-gasoline) since 1993.
Retail and Food service sales, ex-gasoline, increased by 5.6% on a YoY basis.
 Sales in March were below expectations, and sales in January were revised down, however, sales in February were revised up.
Thursday, April 13, 2023
Friday: Retail Sales, Industrial Production
by Calculated Risk on 4/13/2023 09:01:00 PM
 Note: Mortgage rates are from MortgageNewsDaily.com and are for top tier scenarios.
Froday:
• At 8:30 AM ET, Retail sales for March is scheduled to be released. The consensus is for a 0.4% decrease in retail sales.
• At 9:15 AM, The Fed will release Industrial Production and Capacity Utilization for March. The consensus is for a 0.2% increase in Industrial Production, and for Capacity Utilization to decrease to 79.0%.
• At 10:00 AM, University of Michigan's Consumer sentiment index (Preliminary for April).
U.S. Demographics: Largest 5-year cohorts, and Ten most Common Ages in 2022
by Calculated Risk on 4/13/2023 02:35:00 PM
Nine years ago, I wrote: Census Bureau: Largest 5-year Population Cohort is now the "20 to 24" Age Group.
Earlier the Census Bureau released the population estimates for July 2022 by age, and I've updated the table from the previous post.
The table below shows the top 10 cohorts by size for 2010, 2022 (released recently), and the most recent Census Bureau projections for 2030.
In 2022, the top 6 cohorts were under 45 (the Boomers are fading away), and by 2030 the top 10 cohorts will be the youngest 10 cohorts.
There will be plenty of "gray hairs" walking around in 2030, but the key for the economy is the population in the prime working age group is now increasing.
As I noted in 2014, this was positive for apartments, and more recently positive for housing.
| Population: Largest 5-Year Cohorts by Year | ||||
|---|---|---|---|---|
| Largest Cohorts | 2010 | 2022 | 2030 | |
| 1 | 45 to 49 years | 30 to 34 years | 35 to 39 years | |
| 2 | 50 to 54 years | 20 to 24 years | 40 to 44 years | |
| 3 | 15 to 19 years | 35 to 39 years | 30 to 34 years | |
| 4 | 20 to 24 years | 25 to 29 years | 25 to 29 years | |
| 5 | 25 to 29 years | 15 to 19 years | 20 to 24 years | |
| 6 | 40 to 44 years | 40 to 44 years | 45 to 49 years | |
| 7 | 10 to 14 years | 60 to 64 years | 5 to 9 years | |
| 8 | 5 to 9 years | 55 to 59 years | 10 to 14 years | |
| 9 | Under 5 years | 10 to 14 years | Under 5 years | |
| 10 | 35 to 39 years | 50 to 54 years | 15 to 19 years | |

Click on graph for larger image.
This graph, based on the 2022 population estimate, shows the U.S. population by age in July 2022 according to the Census Bureau.
Note that the largest age group is in the early-to-mid 30s. There is also a large cohort in their early 20s.
And below is a table showing the ten most common ages in 2010, 2021, and 2030 (projections are from the Census Bureau, 2017).
Note the younger baby boom generation dominated in 2010. In 2022 the millennials had taken over and the boomers are off the list.
This is why - a number of years ago - I was so positive on housing. And this is a positive for the economy.
| Population: Most Common Ages by Year | ||||
|---|---|---|---|---|
| 2010 | 2022 | 2030 | ||
| 1 | 50 | 32 | 39 | |
| 2 | 49 | 31 | 40 | |
| 3 | 19 | 21 | 38 | |
| 4 | 48 | 30 | 37 | |
| 5 | 47 | 22 | 36 | |
| 6 | 46 | 33 | 41 | |
| 7 | 20 | 29 | 35 | |
| 8 | 45 | 34 | 30 | |
| 9 | 18 | 28 | 34 | |
| 10 | 52 | 23 | 33 | |
IMPORTANT NOTE: The data above is based on the Census 2022 estimates and 2017 projections. Housing economist Tom Lawler has pointed out some questions about earlier Census estimates, see: Lawler: "New Long-Term Population Projections Show Slower Growth than Previous Projections but Are Still Too High"


