 RSS Feed
 by Calculated Risk on 4/19/2023 07:00:00 AM
Wednesday, April 19, 2023
MBA: Mortgage Applications Decreased in Weekly Survey
From the MBA: Mortgage Applications Decrease in Latest MBA Weekly Survey
Mortgage applications decreased 8.8 percent from one week earlier, according to data from the Mortgage Bankers Association’s (MBA) Weekly Mortgage Applications Survey for the week ending April 14, 2023.
The Market Composite Index, a measure of mortgage loan application volume, decreased 8.8 percent on a seasonally adjusted basis from one week earlier. On an unadjusted basis, the Index decreased 8 percent compared with the previous week. The Refinance Index decreased 6 percent from the previous week and was 56 percent lower than the same week one year ago. The seasonally adjusted Purchase Index decreased 10 percent from one week earlier. The unadjusted Purchase Index decreased 9 percent compared with the previous week and was 36 percent lower than the same week one year ago.
“Last week’s increase in mortgage rates prompted a pullback in application activity. With more first-time homebuyers in the market, we continue to see increased sensitivity to rate changes. The 30-year fixed rate increased 13 basis points to 6.43 percent, which led to purchase applications declining 10 percent,” said Joel Kan, MBA’s Vice President and Chief Economist. “Affordability challenges persist and there is limited for-sale inventory in many markets across the country, so buyers remain selective on when they act. The 10-percent drop in FHA purchase applications, and the increase in the average purchase loan size to its highest level in a month, are other indications that first-time buyers have pulled back. The spread between the jumbo and conforming 30-year fixed rates widened slightly last week to 15 basis points, but this was a much tighter spread compared to the past year. As banks reduce their willingness to hold jumbo loans, we expect this narrowing trend to continue.”
Added Kan, “Refinances also declined and accounted for just over a quarter of all applications, as rates remained more than a full percentage point above the same week a year ago. This leaves very little refinance incentive for most homeowners.”
..
The average contract interest rate for 30-year fixed-rate mortgages with conforming loan balances ($726,200 or less) increased to 6.43 percent from 6.30 percent, with points increasing to 0.63 from 0.55 (including the origination fee) for 80 percent loan-to-value ratio (LTV) loans.
emphasis added
 Click on graph for larger image.
The first graph shows the MBA mortgage purchase index.
According to the MBA, purchase activity is down 36% year-over-year unadjusted.
Red is a four-week average (blue is weekly).

The second graph shows the refinance index since 1990.
With higher mortgage rates, the refinance index declined sharply in 2022.
Tuesday, April 18, 2023
Wednesday: Architecture Billings Index, Beige Book
by Calculated Risk on 4/18/2023 08:12:00 PM
 Note: Mortgage rates are from MortgageNewsDaily.com and are for top tier scenarios.
Wednesday:
• At 7:00 AM ET, The Mortgage Bankers Association (MBA) will release the results for the mortgage purchase applications index.
• During the day: The AIA's Architecture Billings Index for March (a leading indicator for commercial real estate).
• At 2:00 PM, the Federal Reserve Beige Book, an informal review by the Federal Reserve Banks of current economic conditions in their Districts.
Misery Index
by Calculated Risk on 4/18/2023 12:12:00 PM
For fun, here is a graph of economist Arthur Okun's misery index (popularized by President Reagan).
Okun added inflation and the unemployment rate together as a measure of "misery".
 Click on graph for larger image.
Currently YoY inflation is at 5.0%, and the unemployment rate is at 3.5% for a "misery index" value of 8.5.
This is down from 9.6 in February, and below the median of 9.6 over the last 50 years.
March Housing Starts: Most Multi-family Under Construction Since 1973
by Calculated Risk on 4/18/2023 09:07:00 AM
Today, in the CalculatedRisk Real Estate Newsletter: March Housing Starts: Most Multi-family Under Construction Since 1973
Excerpt:
The fourth graph shows housing starts under construction, Seasonally Adjusted (SA).There is much more in the post. You can subscribe at https://calculatedrisk.substack.com/
Red is single family units. Currently there are 716 thousand single family units (red) under construction (SA). This was down in March compared to February, and 112 thousand below the recent peak in April and May 2022. Single family units under construction have peaked since single family starts are now declining. The reason there are still so many homes under construction is probably due to supply constraints.
Blue is for 2+ units. Currently there are 958 thousand multi-family units under construction. This is the highest level since November 1973! For multi-family, construction delays are probably also a factor. The completion of these units should help with rent pressure.
Combined, there are 1.674 million units under construction, just 37 thousand below the all-time record of 1.711 million set in October 2022.

Housing Starts Decreased to 1.420 million Annual Rate in March
by Calculated Risk on 4/18/2023 08:37:00 AM
From the Census Bureau: Permits, Starts and Completions
Housing Starts:
Privately‐owned housing starts in March were at a seasonally adjusted annual rate of 1,420,000. This is 0.8 percent below the revised February estimate of 1,432,000 and is 17.2 percent below the March 2022 rate of 1,716,000. Single‐family housing starts in March were at a rate of 861,000; this is 2.7 percent above the revised February figure of 838,000. The March rate for units in buildings with five units or more was 542,000.
Building Permits:
Privately‐owned housing units authorized by building permits in March were at a seasonally adjusted annual rate of 1,413,000. This is 8.8 percent below the revised February rate of 1,550,000 and is 24.8 percent below the March 2022 rate of 1,879,000. Single‐family authorizations in March were at a rate of 818,000; this is 4.1 percent above the revised February figure of 786,000. Authorizations of units in buildings with five units or more were at a rate of 543,000 in March
emphasis added
 Click on graph for larger image.
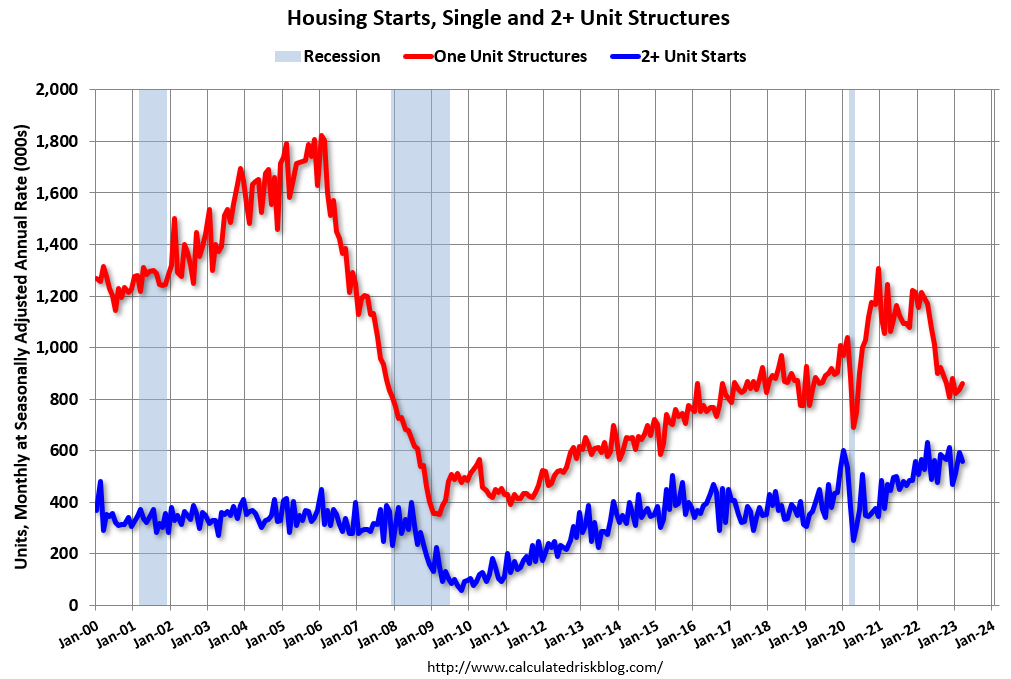
The first graph shows single and multi-family housing starts for the last several years.
Multi-family starts (blue, 2+ units) decreased in March compared to February. Multi-family starts were up 6.5% year-over-year in March.
Single-family starts (red) increased in March and were down 27.7% year-over-year.
 The second graph shows single and multi-family housing starts since 1968.
 This shows the huge collapse following the housing bubble, and then the eventual recovery - and the recent collapse in single-family starts.
Total housing starts in March were slightly above expectations, however, starts in January and February were revised down slightly, combined.
I'll have more later …
Monday, April 17, 2023
Tuesday: Housing Starts
by Calculated Risk on 4/17/2023 09:01:00 PM
 From Matthew Graham at Mortgage News Daily: Mortgage Rates Suddenly Near 1-Month Highs
After bottoming out at the lowest levels in months in the first week of April, mortgage rates have been rising fairly quickly. As of this afternoon, you'd have to go back nearly a month to see a higher 30yr fixed rate from the average lender.Tuesday:
In the slightly bigger picture, this leaves us slightly higher than the middle of 2023's range marked by lows near 6% in early February and highs just over 7% in early March. [30 year fixed 6.61%]
emphasis added
• At 8:30 AM ET, Housing Starts for March. The consensus is for 1.400 million SAAR, down from 1.450 million SAAR in February.
MBA Survey: "Share of Mortgage Loans in Forbearance Decreases to 0.55% in March"
by Calculated Risk on 4/17/2023 04:00:00 PM
From the MBA: Share of Mortgage Loans in Forbearance Decreases to 0.55% in March
The Mortgage Bankers Association’s (MBA) monthly Loan Monitoring Survey revealed that the total number of loans now in forbearance decreased by 5 basis points from 0.60% of servicers’ portfolio volume in the prior month to 0.55% as of March 31, 2023. According to MBA’s estimate, 275,000 homeowners are in forbearance plans. Mortgage servicers have provided forbearance to approximately 7.8 million borrowers since March 2020.
In March 2023, the share of Fannie Mae and Freddie Mac loans in forbearance decreased 2 basis points to 0.26%. Ginnie Mae loans in forbearance decreased 10 basis points to 1.18%, and the forbearance share for portfolio loans and private-label securities (PLS) decreased 10 basis points to 0.68%.
“As the COVID-19 national emergency draws to a close, the number of loans in forbearance continues to drop,” said Marina Walsh, CMB, MBA’s Vice President of Industry Analysis. “Mortgage performance remains strong with the percentage of borrowers who were current on their mortgage payments and post-forbearance workouts increasing in March.”
Adds Walsh, “MBA’s forecast still calls for a recession in 2023, which may change the current performance levels, but credit quality is generally good and many borrowers facing financial hardship can now access enhanced loss mitigation options that resulted from successes of pandemic-related policies.”
emphasis added
 Click on graph for larger image.
This graph shows the percent of portfolio in forbearance by investor type over time.
The share of forbearance plans has been decreasing, declined to 0.55% in March from 0.60% in February.
At the end of March, there were about 275,000 homeowners in forbearance plans.
Lawler on Demographics: New Population Estimates Incorporate Unprecedented Methodological Changes
by Calculated Risk on 4/17/2023 11:30:00 AM
Today, in the Calculated Risk Real Estate Newsletter: Lawler on Demographics: New Population Estimates Incorporate Unprecedented Methodological Changes
A brief excerpt:
Demographics are very useful in predicting long term trends for housing and the economy.There is much more in the article. You can subscribe at https://calculatedrisk.substack.com/
The following note from housing economist Tom Lawler discusses the most recent release from the Census Bureau.
Last week Census released its “Vintage 2022” estimates of the US resident population by single year of age, and the estimates incorporated unprecedented methodological changes that, if accurate, significantly changed estimates of the age distributions of the US population from previous “vintage” estimates.
In December Census noted that because of some “issues” with Census 2020, it would create a “blended” base (or decadal starting point) for April 1, 2020 that would incorporate age and sex data from the 2020 Demographic Analysis. Stated another way, for (I believe) the first time ever the starting point for this decade’s population estimates do NOT reflect the age distribution from the Decennial Census. Here is an excerpt from its methodology section.“At the national level, then, it is accurate to say that resident, household, and group quarters (GQ) population totals are derived from the 2020 Census, age and sex detail is drawn from 2020 DA, and race and Hispanic origin detail comes from V2020.”Incorporation of this “blended” base resulted in significant changes in the age distribution of the resident population, as shown in the table below.
As the table shows, while the total population estimates for 4/1/2020 are virtually unchanged, there were sizable changes in population estimates for various age groups.
...
CR Note: ... This estimated change in the late teens / early 20’s population in 2020 - that Lawler highlighted - is important (if accurate) for multi-family housing.

NAHB: Builder Confidence Increased Slightly in April
by Calculated Risk on 4/17/2023 10:06:00 AM
The National Association of Home Builders (NAHB) reported the housing market index (HMI) was at 45, up from 44 last month. Any number below 50 indicates that more builders view sales conditions as poor than good.
From the NAHB: Lack of Existing Inventory Continues to Support Builder Sentiment
Builders remained cautiously optimistic in April as limited resale inventory helped to increase demand in the new home market even as the industry continues to grapple with building material issues.
Builder confidence in the market for newly built single-family homes in April rose one point to 45, according to the National Association of Home Builders (NAHB)/Wells Fargo Housing Market Index (HMI).
Currently, one-third of housing inventory is new construction, compared to historical norms of a little more than 10%. More buyers looking at new homes, along with the use of sales incentives, have supported new home sales since the start of 2023.
...
The HMI index gauging current sales conditions in April rose two points to 51 and the component charting sales expectations in the next six months increased three points to 50. This marks the first time these components both returned to the 50+ range since June 2022. The gauge measuring traffic of prospective buyers remained unchanged at 31. This is the first time the traffic component failed to improve in 2023.
Looking at the three-month moving averages for regional HMI scores, the Northeast rose four points to 46, the Midwest edged up two points to 37, the South increased four points to 49 and the West moved four points higher to 38.
emphasis added
 Click on graph for larger image.
This graph shows the NAHB index since Jan 1985.
This was at the consensus forecast.
The "traffic of prospective buyers" is still well below breakeven at 31 (below 50).
Housing April 17th Weekly Update: Inventory Decreased 1.3% Week-over-week
by Calculated Risk on 4/17/2023 08:25:00 AM
Altos reports that active single-family inventory was down 1.3% week-over-week. Inventory still hasn't bottomed seasonally.
 Click on graph for larger image.
This inventory graph is courtesy of Altos Research.
As of April 14th, inventory was at 405 thousand (7-day average), compared to 411 thousand the prior week.
Year-to-date, inventory is down 17.4%.

The red line is for 2023. The black line is for 2019. Note that inventory is up from the previous two years (the record low was in 2022), but still well below normal levels.
Inventory was up 51.6% compared to the same week in 2022 (last week it was up 59.1%), and down 52.4% compared to the same week in 2019 (last week down 50.9%).
A key will be when inventory starts increasing in 2023.
Mike Simonsen discusses this data regularly on Youtube.


