 RSS Feed
 by Calculated Risk on 4/25/2023 09:01:00 PM
Tuesday, April 25, 2023
Wednesday: Durable Goods
 Note: Mortgage rates are from MortgageNewsDaily.com and are for top tier scenarios.
Wednesday:
• At 7:00 AM ET, The Mortgage Bankers Association (MBA) will release the results for the mortgage purchase applications index.
• At 8:30 AM, Durable Goods Orders for March from the Census Bureau. The consensus is for a 0.9% increase in durable goods orders.
Las Vegas March 2023: Visitor Traffic Down 1.1% Compared to 2019; Convention Traffic Up 39.6%
by Calculated Risk on 4/25/2023 02:07:00 PM
Note: I like using Las Vegas as a measure of recovery for both leisure (visitors) and business (conventions). Vegas is Back!
From the Las Vegas Visitor Authority: March 2023 Las Vegas Visitor Statistics
Benefitting from a mix of headliners and events from NASCAR to Taylor Swift to several college basketball tournaments, paired with a robust convention month that included the triennial CONEXPO‐CON/AGG tradeshow and its 140k+ attendees, Las Vegas visitation neared 3.7M in Mar 2023, up +9.6% YoY and nearly matching Mar 2019.
Overall hotel occupancy exceeded 88% for the month, +7.7 pts YoY. Achieving impressive levels by both pre and post‐pandemic standards, Weekend occupancy reached 94.5% for the month (+2.4 pts YoY) while conventions helped propel Midweek occupancy to 85.8%, +9.2 pts YoY.
Overall ADR exceeded $213, breaking the record from just a few months ago (Oct 2022, $208) and surpassing Mar 2022 and Mar 2019 by +30.7% and +59.2%, respectively. RevPAR also broke records, reaching $188, +43.2% YoY and +53.6% over Mar 2019
 Click on graph for larger image.
 The first graph shows visitor traffic for 2019 (Black), 2020 (light blue), 2021 (purple), 2022 (orange), and 2023 (red).
Visitor traffic was down 1.1% compared to the same month in 2019.
Visitor traffic was up 9.6% compared to last March.
The second graph shows convention traffic.

Convention traffic was up 39.6% compared to March 2019, and up 56.0% compared to March 2022.The second graph shows convention traffic.

Note: There was almost no convention traffic from April 2020 through May 2021.
New Home Sales Increase to 683,000 Annual Rate in March; Likely New Home Sales will be up YoY in Mid-2023
by Calculated Risk on 4/25/2023 10:50:00 AM
Today, in the Calculated Risk Real Estate Newsletter: New Home Sales Increase to 683,000 Annual Rate in March
Brief excerpt:
The next graph shows new home sales for 2022 and 2023 by month (Seasonally Adjusted Annual Rate). Sales in March 2023 were down 3.4% from March 2022.You can subscribe at https://calculatedrisk.substack.com/.
It seems likely that new home sales will be up year-over-year sometime in the next few months.
...
As previously discussed, the Census Bureau overestimates sales, and underestimates inventory when cancellation rates are rising, see: New Home Sales and Cancellations: Net vs Gross Sales. This has reversed now since cancellation rates have started to decline. When a previously cancelled home is resold, the home builder counts it as a sale, but the Census Bureau does not (since it was already counted).
There are still a large number of homes under construction, and this suggests we might see a further increase in completed inventory over the next several months, but in general, this is a positive report for new home sales.

New Home Sales Increase to 683,000 Annual Rate in March
by Calculated Risk on 4/25/2023 10:07:00 AM
The Census Bureau reports New Home Sales in March were at a seasonally adjusted annual rate (SAAR) of 683 thousand.
The previous three months were revised down slightly, combined.
Sales of new single‐family houses in March 2023 were at a seasonally adjusted annual rate of 683,000, according to estimates released jointly today by the U.S. Census Bureau and the Department of Housing and Urban Development. This is 9.6 percent above the revised February rate of 623,000, but is 3.4 percent below the March 2022 estimate of 707,000.
emphasis added
 Click on graph for larger image.
The first graph shows New Home Sales vs. recessions since 1963. The dashed line is the current sales rate.
New home sales are close to pre-pandemic levels.
The second graph shows New Home Months of Supply.
 The months of supply decreased in March to 7.6 months from 8.4 months in February.
 The all-time record high was 12.2 months of supply in January 2009. The all-time record low was 3.3 months in August 2020.
This is well above the top of the normal range (about 4 to 6 months of supply is normal).
"The seasonally‐adjusted estimate of new houses for sale at the end of March was 432,000. This represents a supply of 7.6 months at the current sales rate."Sales were above expectations of 630 thousand SAAR, however, sales in the three previous months were revised down slightly, combined. I'll have more later today.
Comments on February Case-Shiller and FHFA House Prices
by Calculated Risk on 4/25/2023 09:46:00 AM
Today, in the Calculated Risk Real Estate Newsletter: Case-Shiller: National House Price Index "Declines Moderated" to 2.0% year-over-year increase in February
Excerpt:
Both the Case-Shiller House Price Index (HPI) and the Federal Housing Finance Agency (FHFA) HPI for February were released today. Here is a graph of the month-over-month (MoM) change in the Case-Shiller National Index Seasonally Adjusted (SA).
The Case-Shiller Home Price Indices for "February" is a 3-month average of December, January and February closing prices. December closing prices include some contracts signed in October, so there is a significant lag to this data.
The MoM increase in the seasonally adjusted Case-Shiller National Index was at 0.16%. This increase followed seven consecutive MoM decreases.
On a seasonally adjusted basis, prices declined in 11 of 20 Case-Shiller cities on a month-to-month basis. The largest monthly declines seasonally adjusted were in Seattle (-1.5%), Las Vegas (-0.9%), and Portland (-0.4%). Seasonally adjusted, San Francisco has fallen 13.5% from the peak in May 2022 and Seattle is down 12.8% from the peak. All 20 cities have seen price declines from the recent peak (SA).

There is much more in the article. You can subscribe at https://calculatedrisk.substack.com/
Case-Shiller: National House Price Index "Declines Moderated" to 2.0% year-over-year increase in February
by Calculated Risk on 4/25/2023 09:15:00 AM
S&P/Case-Shiller released the monthly Home Price Indices for February ("February" is a 3-month average of December, January and February closing prices).
This release includes prices for 20 individual cities, two composite indices (for 10 cities and 20 cities) and the monthly National index.
From S&P: S&P Corelogic Case-Shiller Index Declines Moderated in February
The S&P CoreLogic Case-Shiller U.S. National Home Price NSA Index, covering all nine U.S. census divisions, reported a 2.0% annual gain in February, down from 3.7% in the previous month. The 10-City Composite annual increase came in at 0.4%, down from 2.5% in the previous month. The 20-City Composite posted a 0.4% year-over-year gain, down from 2.6% in the previous month.
Miami, Tampa, and Atlanta again reported the highest year-over-year gains among the 20 cities in February. The order remained the same with Miami leading the way with a 10.8% year-over-year price increase, followed by Tampa in second with a 7.7% increase, and Atlanta in third with a 6.6% increase. All 20 cities reported lower prices in the year ending February 2023 versus the year ending January 2023.
...
Before seasonal adjustment, the U.S. National Index posted a 0.2% month-over-month increase in February, while the 10-City and 20-City Composites posted increases of 0.3% and 0.2%, respectively.
After seasonal adjustment, the U.S. National Index posted a month-over-month increase of 0.2%, while both the 10-City and 20-City Composites posted increases of 0.1%.
In January, before seasonal adjustment, 19 cities reported declines with only Miami reporting an increase at 0.1%. After seasonal adjustment, 15 cities reported declines while Miami, Boston, Charlotte, and Cleveland had slight increases.
“Home price trends moderated in February 2023,” says Craig J. Lazzara, Managing Director at S&P DJI. “The National Composite, which had declined for seven consecutive months, rose a modest 0.2% in February, and now stands 4.9% below its June 2022 peak. Our 10- and 20-City Composites performed similarly, with February gains of 0.3% and 0.2%; these Composites are currently 6.0% and 6.6% below their respective peaks. On a trailing 12-month basis, the National Composite is only 2.0% above its level in February 2022; the 10- and 20-City Composites are both up 0.4% on a year-over-year basis."
emphasis added
 Click on graph for larger image.
 The first graph shows the nominal seasonally adjusted Composite 10, Composite 20 and National indices (the Composite 20 was started in January 2000).
The Composite 10 index is up 0.1% in February (SA) and down 4.3% from the recent peak in June 2022.
The Composite 20 index is up 0.1% (SA) in February and down 4.6% from the recent peak in June 2022.
The National index is up 0.2% (SA) in February and is down 2.8% from the peak in June 2022.
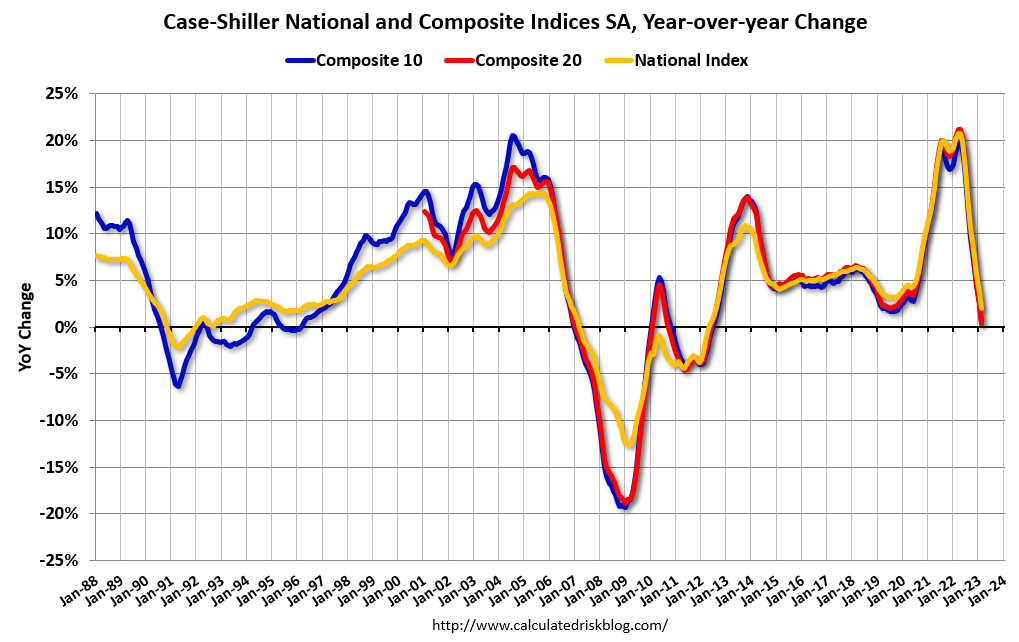 The second graph shows the year-over-year change in all three indices.
The Composite 10 SA is up 0.4% year-over-year. The Composite 20 SA is up 0.4% year-over-year.
The National index SA is up 2.0% year-over-year.
Annual price increases were below expectations. I'll have more later.
Monday, April 24, 2023
Tuesday: New Home Sales, Case-Shiller House Prices
by Calculated Risk on 4/24/2023 09:00:00 PM
 From Matthew Graham at Mortgage News Daily: Mortgage Rates Slightly Lower to Start The Week
The average lender moved slightly lower in cost. The change was small enough that most borrowers will see it in the form of a modest reduction in upfront costs without any change in the quoted interest rate (relative to what the same scenario would have been quoted on Friday). [30 year fixed 6.59%]Tuesday:
emphasis added
• At 9:00 AM ET, S&P/Case-Shiller House Price Index for February. The consensus is for a 2.5% year-over-year increase in the Comp 20 index for February.
• Also at 9:00 AM, FHFA House Price Index for February. This was originally a GSE only repeat sales, however there is also an expanded index.
• At 10:00 AM, New Home Sales for March from the Census Bureau. The consensus is for 630 thousand SAAR, down from 640 thousand in February.
• At 10:00 AM, Richmond Fed Survey of Manufacturing Activity for April.
Vehicle Sales Forecast: "April U.S. Light-Vehicle Sales to Post Strong Growth"
by Calculated Risk on 4/24/2023 04:27:00 PM
From WardsAuto: April U.S. Light-Vehicle Sales to Post Strong Growth; Inventory to Fall from March (pay content). Brief excerpt:
Even though the seasonally adjusted annual rate could decline slightly from the prior quarter’s 15.2 million units, sales volume is forecast to rise a robust 13% year-over-year in Q2. Inventory will undergo a seasonally related month-to-month decline in April but resume growth by the end of the quarter.
emphasis added
 Click on graph for larger image.
This graph shows actual sales from the BEA (Blue), and Wards forecast for April (Red).
The Wards forecast of 15.5 million SAAR, would be up 4.6% from last month, and up 8.5% from a year ago.
Vehicle sales are usually a transmission mechanism for Federal Open Market Committee (FOMC) policy, although far behind housing. This time vehicle sales were more suppressed by supply chain issues and have picked up recently.
Final Look at Local Housing Markets in March
by Calculated Risk on 4/24/2023 09:56:00 AM
Today, in the Calculated Risk Real Estate Newsletter: Final Look at Local Housing Markets in February
A brief excerpt:
Every month I track about 40 local housing markets in the US to get an early sense of changes in the housing market. After the National Association of Realtors® (NAR) releases the monthly existing home sales report, I pick up additional local market data that is reported after the NAR (and I’m frequently adding more markets). This is the final look at local markets in March.There is much more in the article. You can subscribe at https://calculatedrisk.substack.com/
The big story for March existing home sales was the sharp year-over-year (YoY) decline in sales. Also, active inventory increased YoY, but is still historically low - and new listings were down YoY.
First, here is a table comparing the year-over-year Not Seasonally Adjusted (NSA) declines in sales this year from the National Association of Realtors® (NAR) with the local markets I track. So far, these measures have tracked closely. The NAR reported sales were down 23.0% NSA YoY in February.
...
Note: Even if existing home sales activity bottomed in December (4.03 million SA) and January (4.00 million SA), there are usually two bottoms for housing - the first for activity and the second for prices. See Has Housing "Bottomed"?
My early expectation is we will see a somewhat similar YoY sales decline NSA in April as in March. Even though mortgage rates were higher for contracts signed in March (closed sales in April will be mostly for contracts signed in February and March) sales were already declining in March 2022, as 30-year mortgage rates moved above 4% for the first time since early 2019 (yes, rates were below 4% prior to the pandemic).
More local data coming in May for activity in April!

Housing April 24th Weekly Update: Inventory Increased 2.1% Week-over-week
by Calculated Risk on 4/24/2023 08:30:00 AM
Altos reports that active single-family inventory was up 2.1% week-over-week. Maybe inventory has finally bottomed seasonally. This is the highest inventory level since the week ending March 17th.
 Click on graph for larger image.
This inventory graph is courtesy of Altos Research.
As of April 21st, inventory was at 414 thousand (7-day average), compared to 405 thousand the prior week.
Year-to-date, inventory is down 15.6%.

The red line is for 2023. The black line is for 2019. Note that inventory is up from the previous two years (the record low was in 2022), but still well below normal levels.
Inventory was up 52.5% compared to the same week in 2022 (last week it was up 51.6%), and down 52.1% compared to the same week in 2019 (last week down 52.4%).
A key will be when inventory starts increasing in 2023 - maybe this is the beginning. If this is the seasonal bottom, it is late in the year (similar timing as 2021).
Mike Simonsen discusses this data regularly on Youtube.


