 RSS Feed
 by Calculated Risk on 4/27/2023 08:50:00 PM
Thursday, April 27, 2023
Friday: Personal Income & Outlays
 Note: Mortgage rates are from MortgageNewsDaily.com and are for top tier scenarios.
Friday:
• At 8:30 AM ET, Personal Income and Outlays, March 2023. The consensus is for a 0.2% increase in personal income, and for a 0.1% decrease in personal spending. And for the Core PCE price index to increase 0.3%. PCE prices are expected to be up 4.1% YoY, and core PCE prices up 4.5% YoY.
• At 9:45 AM, Chicago Purchasing Managers Index for April. The consensus is for a reading of 43.5, down from 43.8 in March.
• At 10:00 AM, University of Michigan's Consumer sentiment index (Final for April). The consensus is for a reading of 63.5.
Realtor.com Reports Weekly Active Inventory Up 39% YoY; New Listings Down 21% YoY
by Calculated Risk on 4/27/2023 02:52:00 PM
Realtor.com has monthly and weekly data on the existing home market. Here is their weekly report released today from chief economist Danielle Hale: Weekly Housing Trends View — Data Week Ending Apr 22, 2023
• Active inventory was up at a slower pace, with for-sale homes up just 39% above one year ago. The number of homes for sale continues to climb, but hesitant seller participation is limiting the pace of growth. As a result, a greater share of current for-sale inventory is new construction.
...
• New listings–a measure of sellers putting homes up for sale–were down again this week, by 21% from one year ago. The number of newly listed homes has been lower than the same time the previous year for the past 42 weeks.
 Here is a graph of the year-over-year change in inventory according to realtor.com.
 Inventory is still up year-over-year - from record lows - however, the YoY increase has slowed sharply recently.
This was the smallest YoY increase since October.
The recent trend suggests active inventory could be down YoY in Q3!
NMHC: "Apartment Market Continues to Loosen"
by Calculated Risk on 4/27/2023 12:00:00 PM
Today, in the Calculated Risk Real Estate Newsletter: NMHC: "Apartment Market Continues to Loosen"
A brief excerpt:
From the NMHC: Apartment Market Continues to Loosen, Transactions Pull Back Further Amidst Economic UncertaintyThere is more in the article. You can subscribe at https://calculatedrisk.substack.com/“Apartment operators reported an uptick in vacancies and concessions this quarter,” noted NMHC’s Vice President of Research Caitlin Sugrue Walter.
...
• The Market Tightness Index came in at 31 this quarter—below the breakeven level (50)—indicating looser market conditions for the third consecutive quarter. More than half of respondents (51%) reported markets to be looser than three months ago, while only 14% thought markets have become tighter. Meanwhile, around a third of respondents (34%) thought that market conditions were unchanged over the past three months.
NAR: Pending Home Sales Decreased 5.2% in March; Down 23.2% Year-over-year
by Calculated Risk on 4/27/2023 10:03:00 AM
From the NAR: Pending Home Sales Decreased 5.2% in March
Pending home sales decreased in March for the first time since November 2022, according to the National Association of REALTORS®. Three U.S. regions posted monthly losses, while the South increased. All four regions saw year-over-year declines in transactions.This is way below expectations of a 1.0% decrease for this index. Note: Contract signings usually lead sales by about 45 to 60 days, so this would usually be for closed sales in April and May.
The Pending Home Sales Index (PHSI)* – a forward-looking indicator of home sales based on contract signings – waned by 5.2% to 78.9 in March. Year over year, pending transactions dropped by 23.2%. An index of 100 is equal to the level of contract activity in 2001.
"The lack of housing inventory is a major constraint to rising sales," said NAR Chief Economist Lawrence Yun. "Multiple offers are still occurring on about a third of all listings, and 28% of homes are selling above list price. Limited housing supply is simply not meeting demand nationally."
...
The Northeast PHSI fell 8.1% from last month to 66.6, a decline of 24.3% from March 2022. The Midwest index dropped 10.7% to 75.7 in March, down 21.5% from one year ago.
The South PHSI improved 0.2% to 99.6 in March, falling 19.8% from the prior year. The West index decreased 8.0% in March to 59.4, reducing 32.2% from March 2022.
emphasis added
BEA: Real GDP increased at 1.1% Annualized Rate in Q1
by Calculated Risk on 4/27/2023 08:38:00 AM
From the BEA: Gross Domestic Product, First Quarter 2023 (Advance Estimate)
Real gross domestic product (GDP) increased at an annual rate of 1.1 percent in the first quarter of 2023, according to the "advance" estimate released by the Bureau of Economic Analysis. In the fourth quarter, real GDP increased 2.6 percent.PCE increased at a 3.7% annual rate, and residential investment decreased at a 4.2% rate. The advance Q1 GDP report, with 1.1% annualized increase, was below expectations.
The increase in real GDP reflected increases in consumer spending, exports, federal government spending, state and local government spending, and nonresidential fixed investment that were partly offset by decreases in private inventory investment and residential fixed investment. Imports, which are a subtraction in the calculation of GDP, increased .
The increase in consumer spending reflected increases in both goods and services. Within goods, the leading contributor was motor vehicles and parts. Within services, the increase was led by health care and food services and accommodations. Within exports, an increase in goods (led by consumer goods, except food and automotive) was partly offset by a decrease in services (led by transport). Within federal government spending, the increase was led by nondefense spending. The increase in state and local government spending primarily reflected an increase in compensation of state and local government employees. Within nonresidential fixed investment, increases in structures and intellectual property products were partly offset by a decrease in equipment.
The decrease in private inventory investment was led by wholesale trade (notably, machinery, equipment, and supplies) and manufacturing (led by other transportation equipment as well as petroleum and coal products). Within residential fixed investment, the leading contributor to the decrease was new single-family construction. Within imports, the increase reflected an increase in goods (mainly durable consumer goods and automotive vehicles, engines, and parts).
emphasis added
The decrease in inventories subtracted 2.26 percentage points from GDP.
I'll have more later ...
I'll have more later ...
Weekly Initial Unemployment Claims decrease to 230,000
by Calculated Risk on 4/27/2023 08:32:00 AM
The DOL reported:
In the week ending April 22, the advance figure for seasonally adjusted initial claims was 230,000, a decrease of 16,000 from the previous week's revised level. The previous week's level was revised up by 1,000 from 245,000 to 246,000. The 4-week moving average was 236,000, a decrease of 4,000 from the previous week's revised average. The previous week's average was revised up by 250 from 239,750 to 240,000.The following graph shows the 4-week moving average of weekly claims since 1971.
emphasis added
 Click on graph for larger image.
The dashed line on the graph is the current 4-week average. The four-week average of weekly unemployment claims decreased to 236,000.
The previous week was revised up.
Weekly claims were below the consensus forecast.
Wednesday, April 26, 2023
Thursday: GDP, Unemployment Claims, Pending Home Sales
by Calculated Risk on 4/26/2023 08:55:00 PM
 Note: Mortgage rates are from MortgageNewsDaily.com and are for top tier scenarios.
Thursday:
• At 8:30 AM ET, The initial weekly unemployment claims report will be released. The consensus is for 250 thousand initial claims, up from 245 thousand last week.
• Also at 8:30 AM, Gross Domestic Product, 1st quarter 2023 (Advance estimate). The consensus is that real GDP increased 2.0% annualized in Q1, down from 2.6% in Q4.
• At 10:00 AM, Pending Home Sales Index for March. The consensus is for a 1.0% increase in the index.
• At 11:00 AM, the Kansas City Fed manufacturing survey for April. This is the last of regional manufacturing surveys for April.
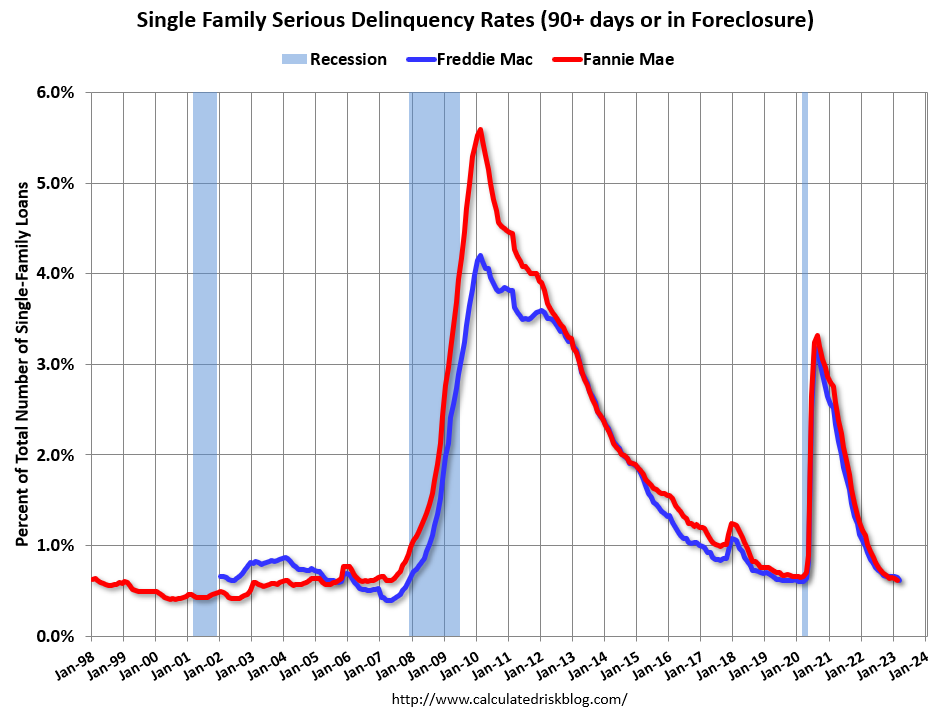
Freddie Mac: Mortgage Serious Delinquency Rate Decreased in March
by Calculated Risk on 4/26/2023 01:37:00 PM
Freddie Mac reported that the Single-Family serious delinquency rate in March was 0.62%, down from 0.65% February. Freddie's rate is down year-over-year from 0.92% in March 2022.
Freddie's serious delinquency rate peaked in February 2010 at 4.20% following the housing bubble and peaked at 3.17% in August 2020 during the pandemic.
These are mortgage loans that are "three monthly payments or more past due or in foreclosure".
 Click on graph for larger image
Mortgages in forbearance are being counted as delinquent in this monthly report but are not reported to the credit bureaus.
The serious delinquency rate was at 0.60% just prior to the pandemic; this is almost back to that level.
Note that multi-family delinquencies have been increasing and were at 0.13% in March, up from 0.08% in March 2022.
Inflation Adjusted House Prices 4.6% Below Peak; Price-to-rent index is 8.4% below recent peak
by Calculated Risk on 4/26/2023 10:17:00 AM
Today, in the Calculated Risk Real Estate Newsletter: Inflation Adjusted House Prices 4.6% Below Peak; Price-to-rent index is 8.4% below recent peak
Excerpt:
It has been 17 years since the bubble peak. In the January Case-Shiller house price index released on Tuesday, the seasonally adjusted National Index (SA), was reported as being 61% above the bubble peak in 2006. However, in real terms, the National index (SA) is about 11% above the bubble peak (and historically there has been an upward slope to real house prices). The composite 20, in real terms, is at the bubble peak.
The inflation adjusted indexes have declined for nine consecutive months in real terms.
People usually graph nominal house prices, but it is also important to look at prices in real terms. As an example, if a house price was $200,000 in January 2000, the price would be almost $340,000 today adjusted for inflation (70% increase). That is why the second graph below is important - this shows "real" prices.
The third graph shows the price-to-rent ratio, and the fourth graph is the affordability index.
There is much more in the article. You can subscribe at https://calculatedrisk.substack.com/
MBA: Mortgage Applications Increased in Weekly Survey
by Calculated Risk on 4/26/2023 07:00:00 AM
From the MBA: Mortgage Applications Increase in Latest MBA Weekly Survey
Mortgage applications increased 3.7 percent from one week earlier, according to data from the Mortgage Bankers Association’s (MBA) Weekly Mortgage Applications Survey for the week ending April 21, 2023.
The Market Composite Index, a measure of mortgage loan application volume, increased 3.7 percent on a seasonally adjusted basis from one week earlier. On an unadjusted basis, the Index increased 5 percent compared with the previous week. The Refinance Index increased 2 percent from the previous week and was 51 percent lower than the same week one year ago. The seasonally adjusted Purchase Index increased 5 percent from one week earlier. The unadjusted Purchase Index increased 6 percent compared with the previous week and was 28 percent lower than the same week one year ago.
“Both conventional and government home purchase applications increased last week. However, activity was still nearly 28 percent below last year’s pace, as high mortgage rates and low supply have slowed the market this year, even as home-price growth has decelerated in many markets across the country,” said Joel Kan, MBA’s Vice President and Deputy Chief Economist. “Refinance applications also increased last week but remained at half of last year’s levels. Although incoming data points to a slowdown in the U.S. economy, markets continue to expect that the Fed will raise short-term rates at its next meeting, which have pushed Treasury yields somewhat higher. As a result of the higher yields, mortgage rates increased for the second straight week to their highest level in over a month, with the 30-year fixed rate now at 6.55 percent.”
..
The average contract interest rate for 30-year fixed-rate mortgages with conforming loan balances ($726,200 or less) increased to 6.55 percent from 6.43 percent, with points remaining at 0.63 (including the origination fee) for 80 percent loan-to-value ratio (LTV) loans.
emphasis added
 Click on graph for larger image.
The first graph shows the MBA mortgage purchase index.
According to the MBA, purchase activity is down 28% year-over-year unadjusted.
Red is a four-week average (blue is weekly).

The second graph shows the refinance index since 1990.
With higher mortgage rates, the refinance index declined sharply in 2022.


