by Calculated Risk on 5/01/2023 08:11:00 AM
Monday, May 01, 2023
Housing May 1st Weekly Update: Inventory Increased 2.0% Week-over-week
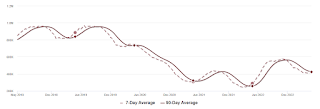 Click on graph for larger image.
This inventory graph is courtesy of Altos Research.

Sunday, April 30, 2023
Monday: ISM Mfg, Construction Spending
by Calculated Risk on 4/30/2023 06:33:00 PM
Weekend:
• Schedule for Week of April 30, 2023
Monday:
• At 10:00 AM ET, ISM Manufacturing Index for April. The consensus is for the ISM to be at 46.8, up from 46.3 in March.
• Also at 10:00 AM, Construction Spending for March. The consensus is for a 0.2% increase in construction spending.
From CNBC: Pre-Market Data and Bloomberg futures S&P 500 and DOW futures are up slightly (fair value).
Oil prices were down over the last week with WTI futures at $76.78 per barrel and Brent at $80.33 per barrel. A year ago, WTI was at $105, and Brent was at $108 - so WTI oil prices are down about 25% year-over-year.
Here is a graph from Gasbuddy.com for nationwide gasoline prices. Nationally prices are at $3.58 per gallon. A year ago, prices were at $4.17 per gallon, so gasoline prices are down $0.59 per gallon year-over-year.
FOMC Preview: Likely 25bp Hike
by Calculated Risk on 4/30/2023 09:01:00 AM
Most analysts expect the FOMC to raise rates 25 basis points and then hint at a pause in June, although it is possible that the FOMC will not increase rates at the meeting this week. However, there hasn't been any leaks of a possible pause at this meeting - so 25 basis points is likely.
"The Committee anticipates that ongoing increases in the target range will be appropriate in order to attain a stance of monetary policy that is sufficiently restrictive to return inflation to 2 percent over time."Then the stresses in the banking system became apparent and inflation eased somewhat quicker than expected. The FOMC statement in March suggested some additional tightening may be appropriate:
emphasis
"The Committee anticipates that some additional policy firming may be appropriate in order to attain a stance of monetary policy that is sufficiently restrictive to return inflation to 2 percent over time."
"We expect the Fed to hike by 25bp at next week’s meeting. More importantly, we think the Fed will signal a pause in June, with a weak bias to hike rather than cut rates going forward. ... The challenge will be to credibly signal an extended hold and push back against market pricing of rate cuts (roughly 60bp in 2023 and 150bp in 2024 at the time of this writing), particularly given the latest bout of banking sector stress.And from Goldman Sachs economists:
Note that the Fed will have the results of the 2Q Senior Loan Officer Opinion Survey (SLOOS) in hand for the May meeting, although the survey results will only be made public in the following week. The Beige Book shows that six of the 12 regional Fed banks reported further credit tightening since the January survey. This suggests that the SLOOS data will reinforce the case for a pause in June.
emphasis added
The FOMC is likely to deliver a widely expected 25bp rate hike to 5-5.25% at its May meeting, but the focus will be on revisions to the forward guidance in its statement. We expect the Committee to signal that it anticipates pausing in June but retains a hawkish bias, stopping earlier than it initially envisioned because bank stress is likely to cause a tightening of credit.
| GDP projections of Federal Reserve Governors and Reserve Bank presidents, Change in Real GDP1 | ||||
|---|---|---|---|---|
| Projection Date | 2023 | 2024 | 2025 | |
| Mar 2023 | 0.0 to 0.8 | 1.0 to 1.5 | 1.7 to 2.1 | |
The unemployment rate was at 3.5% in March. To reach the mid-point of the FOMC projections for Q4 2023, the economy would likely have to lose 1 to 2 million jobs by Q4.
| Unemployment projections of Federal Reserve Governors and Reserve Bank presidents, Unemployment Rate2 | ||||
|---|---|---|---|---|
| Projection Date | 2023 | 2024 | 2025 | |
| Mar 2023 | 4.0 to 4.7 | 4.3 to 4.9 | 4.3 to 4.8 | |
As of March 2022, PCE inflation increased 4.2 percent year-over-year (YoY), down from 5.1 percent YoY in February.
| Inflation projections of Federal Reserve Governors and Reserve Bank presidents, PCE Inflation1 | ||||
|---|---|---|---|---|
| Projection Date | 2023 | 2024 | 2025 | |
| Mar 2023 | 3.0 to 3.8 | 2.2 to 2.8 | 2.0 to 2.2 | |
PCE core inflation was up 4.6% in March year-over-year. This remains a concern for the FOMC, however this includes shelter that was up 8.3% YoY in March.
| Core Inflation projections of Federal Reserve Governors and Reserve Bank presidents, Core Inflation1 | ||||
|---|---|---|---|---|
| Projection Date | 2023 | 2024 | 2025 | |
| Mar 2023 | 3.5 to 3.9 | 2.3 to 2.8 | 2.0 to 2.2 | |
Saturday, April 29, 2023
Real Estate Newsletter Articles this Week: Case-Shiller House Prices up 2.0% YoY
by Calculated Risk on 4/29/2023 02:11:00 PM
At the Calculated Risk Real Estate Newsletter this week:
• Case-Shiller: National House Price Index "Declines Moderated" to 2.0% year-over-year increase in February
• New Home Sales Increase to 683,000 Annual Rate in March
• Inflation Adjusted House Prices 4.6% Below Peak
• Final Look at Local Housing Markets in March
• NMHC: "Apartment Market Continues to Loosen"
• Freddie Mac House Price Index Increased Slightly in March; Up 1.0% Year-over-year
This is usually published 4 to 6 times a week and provides more in-depth analysis of the housing market.
You can subscribe at https://calculatedrisk.substack.com/
Most content is available for free (and no Ads), but please subscribe!
Schedule for Week of April 30, 2023
by Calculated Risk on 4/29/2023 08:11:00 AM
The key report scheduled for this week is the April employment report.
Other key reports include April vehicle sales, and the March trade balance.
The FOMC meets this week, and the FOMC is expected to raise rates 25bp.
For manufacturing, the April ISM manufacturing index will be released.
10:00 AM ET: ISM Manufacturing Index for April. The consensus is for the ISM to be at 46.8, up from 46.3 in March.
10:00 AM: Construction Spending for March. The consensus is for a 0.2% increase in construction spending.
8:00 AM ET: Corelogic House Price index for March.
 10:00 AM ET: Job Openings and Labor Turnover Survey for March from the BLS.
 This graph shows job openings (black line), hires (dark blue), Layoff, Discharges and other (red column), and Quits (light blue column) from the JOLTS.
Jobs openings decreased in February to 9.9 million from 10.6 million in January.
The number of job openings (black) were down 14% year-over-year in February.
 All day: Light vehicle sales for April. The expectation is for light vehicle sales to be 14.8 million SAAR in April, unchanged from 14.8 million in March (Seasonally Adjusted Annual Rate).
This graph shows light vehicle sales since the BEA started keeping data in 1967. The dashed line is the sales rate for the previous month.
7:00 AM ET: The Mortgage Bankers Association (MBA) will release the results for the mortgage purchase applications index.
8:15 AM: The ADP Employment Report for April. This report is for private payrolls only (no government). The consensus is for 135,000 payroll jobs added in April, down from 145,000 added in March.
10:00 AM: the Q1 2023 Housing Vacancies and Homeownership from the Census Bureau.
10:00 AM: the ISM Services Index for April. The consensus is for a reading of 51.7, up from 51.2.
2:00 PM: FOMC Meeting Announcement. The FOMC is expected to raise the Fed Funds rate by 25bp at this meeting and indicate a likely "pause" in June.
2:30 PM: Fed Chair Jerome Powell holds a press briefing following the FOMC announcement.
8:30 AM: The initial weekly unemployment claims report will be released. The consensus is for 243 thousand initial claims, up from 230 thousand last week.
 8:30 AM: Trade Balance report for March from the Census Bureau.
 This graph shows the U.S. trade deficit, with and without petroleum, through the most recent report. The blue line is the total deficit, and the black line is the petroleum deficit, and the red line is the trade deficit ex-petroleum products.
The consensus is the trade deficit to be $63.8 billion. The U.S. trade deficit was at $70.3 billion in February.
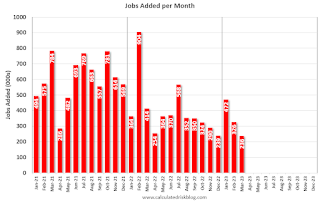 8:30 AM: Employment Report for April. The consensus is for 178,000 jobs added, and for the unemployment rate to increase to 3.6%.
There were 236,000 jobs added in March, and the unemployment rate was at 3.5%.
This graph shows the jobs added per month since January 2022.
Friday, April 28, 2023
COVID Apr 28, 2023, Update: New Pandemic Low for Weekly Deaths
by Calculated Risk on 4/28/2023 09:00:00 PM

| COVID Metrics | ||||
|---|---|---|---|---|
| Now | Week Ago | Goal | ||
| New Cases per Week2 | 88,330 | 97,893 | ≤35,0001 | |
| Hospitalized2 | 9,876 | 11,497 | ≤3,0001 | |
| Deaths per Week2 | 1,052 | 1,246 | ≤3501 | |
| 1my goals to stop weekly posts, 2Weekly for Cases, Currently Hospitalized, and Deaths 🚩 Increasing number weekly for Cases, Hospitalized, and Deaths ✅ Goal met. | ||||
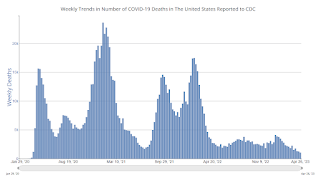 Click on graph for larger image.
This graph shows the weekly (columns) number of deaths reported.
Hotels: Occupancy Rate Up 2.3% Year-over-year
by Calculated Risk on 4/28/2023 03:28:00 PM
U.S. hotel performance increased from the previous week, according to STR‘s latest data through April 22.The following graph shows the seasonal pattern for the hotel occupancy rate using the four-week average.
April 16-22, 2023 (percentage change from comparable week in 2022):
• Occupancy: 67.2% (+2.3%)
• Average daily rate (ADR): $155.76 (+4.2%)
• Revenue per available room (RevPAR): $104.64 (+6.6%)
emphasis added
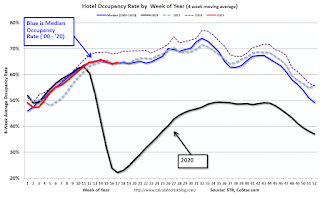 Click on graph for larger image.
The red line is for 2023, black is 2020, blue is the median, and dashed light blue is for 2022. Dashed purple is for 2018, the record year for hotel occupancy.
Fannie Mae: Mortgage Serious Delinquency Rate Decreased in March
by Calculated Risk on 4/28/2023 01:41:00 PM
Fannie Mae reported that the Single-Family Serious Delinquency decreased to 0.59% in March from 0.62% in February. The serious delinquency rate is down from 1.01% in March 2022. This is below the pre-pandemic levels.
These are mortgage loans that are "three monthly payments or more past due or in foreclosure".
The Fannie Mae serious delinquency rate peaked in February 2010 at 5.59% following the housing bubble and peaked at 3.32% in August 2020 during the pandemic.
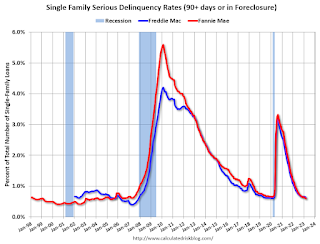
By vintage, for loans made in 2004 or earlier (1% of portfolio), 1.93% are seriously delinquent (down from 2.04% in February).
Mortgages in forbearance were counted as delinquent in this monthly report, but they were not reported to the credit bureaus.
Freddie Mac reported earlier.
Freddie Mac House Price Index Increased Slightly in March; Up 1.0% Year-over-year
by Calculated Risk on 4/28/2023 11:16:00 AM
Today, in the Calculated Risk Real Estate Newsletter: Freddie Mac House Price Index Increased Slightly in March; Up 1.0% Year-over-year
A brief excerpt:
Freddie Mac reported that its “National” Home Price Index (FMHPI) increased 0.3% month-over-month on a seasonally adjusted (SA) basis in March, putting the National FMHPI down 1.3% SA from its June 2022 peak, and down 2.6% Not Seasonally Adjusted (NSA) from the peak.There is much more in the article. You can subscribe at https://calculatedrisk.substack.com/
On a year-over-year basis, the National FMHPI was up 1.0% in March, down from 2.1% YoY in February. The YoY increase peaked at 19.2% in July 2021. ...
In March, 24 states and D.C. were below their 2022 peaks, Seasonally Adjusted. The largest seasonally adjusted declines from the recent peak were in Idaho (-8.8%), Nevada (-7.9%), Arizona (-6.8%), Utah (-6.5%), Washington (-6.3%), California (-5.6%), and Colorado (-4.4%).
In March, house prices in 9 states and D.C. were down YoY, led by Idaho (-7.5% YoY), Nevada (-6.3%) and Washington (-5.1%).
For cities (Core-based Statistical Areas, CBSA), here are the 30 cities with the largest declines from the peak, seasonally adjusted.
PCE Measure of Shelter Still Accelerating YoY
by Calculated Risk on 4/28/2023 08:59:00 AM
Here is a graph of the year-over-year change in shelter from the CPI report and housing from the PCE report this morning, both through March 2023:

Since rents are soft and "Apartment Market Continues to Loosen" this means both CPI and PCE measures are currently overstating actual inflation.


