by Calculated Risk on 5/03/2023 10:57:00 AM
Wednesday, May 03, 2023
Black Knight Mortgage Monitor: Home Prices Increased in March; Prices Up 1.0% YoY
Today, in the Calculated Risk Real Estate Newsletter: Black Knight Mortgage Monitor: Home Prices Increased in March; Prices Up 1.0% YoY
A brief excerpt:
Here is a graph of the Black Knight HPI. The index is still up 1.0% year-over-year and will likely turn negative YoY soon.There is much more in the article. You can subscribe at https://calculatedrisk.substack.com/
• Nationally, home prices rose by 0.45% in March on a seasonally adjusted basis, slightly stronger than the revised 0.43% rise in the prior month
• On a non-adjusted basis, home prices were up 1.38% in March, roughly on par with the 10-year March average of 1.43% (typically the strongest monthly uptick each year)
• Despite prices strengthening this spring, annual home price growth continues to cool; prices were up just 1.0% on an annual basis, a backward-looking metric that has been falling by 1.3-1.4% each month since the start of 2023
• A continuation of recent trends would drop that annual home price growth rate to around 0% when April 2022 metrics are reported next month
emphasis added
HVS: Q1 2023 Homeownership and Vacancy Rates; Rental Vacancy Rates Increased Sharply
by Calculated Risk on 5/03/2023 10:18:00 AM
The Census Bureau released the Residential Vacancies and Homeownership report for Q1 2023.
The results of this survey were significantly distorted by the pandemic in 2020.
This report is frequently mentioned by analysts and the media to track household formation, the homeownership rate, and the homeowner and rental vacancy rates. However, there are serious questions about the accuracy of this survey.
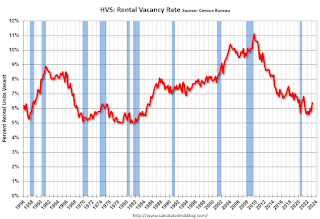
This survey might show the trend, but I wouldn't rely on the absolute numbers. Analysts probably shouldn't use the HVS to estimate the excess vacant supply or household formation, or rely on the homeownership rate, except as a guide to the trend.
National vacancy rates in the first quarter 2023 were 6.4 percent for rental housing and 0.8 percent for homeowner housing. The rental vacancy rate was higher than the rate in the first quarter 2022 (5.8 percent) and higher than the rate in the fourth quarter 2022 (5.8 percent).
The homeowner vacancy rate of 0.8 percent was virtually the same as the rate in the first quarter 2022 (0.8 percent) and virtually the same as the rate in the fourth quarter 2022 (0.8 percent).
The homeownership rate of 66.0 percent was not statistically different from the rate in the first quarter 2022 (65.4 percent) and not statistically different from the rate in the fourth quarter 2022 (65.9 percent).
emphasis added
 Click on graph for larger image.
The HVS homeownership rate was unchanged at 66.0% in Q1, from 66.0% in Q4.
The results in Q2 and Q3 2020 were distorted by the pandemic and should be ignored.
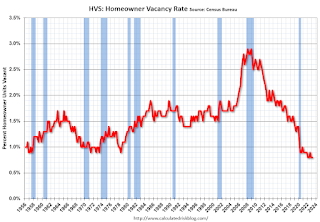 The HVS homeowner vacancy was unchanged at 0.8% in Q1 from 0.8% in Q4.
 Once again - this probably shows the general trend, but I wouldn't rely on the absolute numbers.
ISM® Services Index Increases to 51.9% in April
by Calculated Risk on 5/03/2023 10:05:00 AM
(Posted with permission). The ISM® Services index was at 51.9%, up from 51.2% last month. The employment index decreased to 50.8%, from 51.3%. Note: Above 50 indicates expansion, below 50 in contraction.
From the Institute for Supply Management: Services PMI® at 51.9% April 2023 Services ISM® Report On Business®
Economic activity in the services sector expanded in April for the fourth consecutive month as the Services PMI® registered 51.9 percent, say the nation’s purchasing and supply executives in the latest Services ISM® Report On Business®. The sector has grown in 34 of the last 35 months, with the lone contraction in December.The PMI was slightly above expectations.
The report was issued today by Anthony Nieves, CPSM, C.P.M., A.P.P., CFPM, Chair of the Institute for Supply Management® (ISM®) Services Business Survey Committee: “In April, the Services PMI® registered 51.9 percent, 0.7 percentage point higher than March’s reading of 51.2 percent. The composite index indicated growth in April for the fourth consecutive month after a reading of 49.2 percent in December, the first contraction since May 2020 (45.4 percent). The Business Activity Index registered 52 percent, a 3.4-percentage point decrease compared to the reading of 55.4 percent in March. The New Orders Index expanded in April for the fourth consecutive month after contracting in December for the first time since May 2020; the figure of 56.1 percent is 3.9 percentage points higher than the March reading of 52.2 percent.
“The Supplier Deliveries registered 48.6 percent, 2.8 percentage points higher than the 45.8 percent recorded in March. Looking back beyond the past few months, this month the index has reflected the fastest supplier delivery performance since December 2015, when it registered 48.5 percent. (Supplier Deliveries is the only ISM® Report On Business® index that is inversed; a reading of above 50 percent indicates slower deliveries, which is typical as the economy improves and customer demand increases.)
“The Prices Index was up 0.1 percentage point in April, to 59.6 percent. The Inventories Index contracted in April after two consecutive months of growth preceded by eight straight months of contraction; the reading of 47.2 percent is down 5.6 percentage points from March’s figure of 52.8 percent. The Inventory Sentiment Index (48.9 percent, down 9 percentage points from March’s reading of 57.9 percent) contracted after four consecutive months of growth preceded by a four-month period of contraction.
“Fourteen industries reported growth in April. The Services PMI®, by being above 50 percent for a fourth month after a single month of contraction and a prior 30-month period of expansion, continues to indicate sustained growth for the sector. The composite index has indicated expansion for all but three of the previous 159 months.”
Nieves continues, “There has been a slight uptick in the rate of growth for the services sector, due mostly to the increase in new orders and ongoing improvements in both capacity and supply logistics. The majority of respondents are mostly positive about business conditions; however, some respondents are wary of potential headwinds associated with inflation and an economic slowdown.”
emphasis added
ADP: Private Employment Increased 296,000 in April
by Calculated Risk on 5/03/2023 08:21:00 AM
Private sector employment increased by 296,000 jobs in April and annual pay was up 6.7 percent year-over-year, according to the April ADP® National Employment ReportTM produced by the ADP Research Institute® in collaboration with the Stanford Digital Economy Lab (“Stanford Lab”).This was way above the consensus forecast of 135,000. The BLS report will be released Friday, and the consensus is for 178 thousand non-farm payroll jobs added in April.
...
“The slowdown in pay growth gives the clearest signal of what's going on in the labor market right now,” said Nela Richardson, chief economist, ADP. “Employers are hiring aggressively while holding pay gains in check as workers come off the sidelines. Our data also shows fewer people are switching jobs.”
emphasis added
MBA: Mortgage Applications Decreased in Weekly Survey
by Calculated Risk on 5/03/2023 07:00:00 AM
From the MBA: Mortgage Applications Decrease in Latest MBA Weekly Survey
Mortgage applications decreased 1.2 percent from one week earlier, according to data from the Mortgage Bankers Association’s (MBA) Weekly Mortgage Applications Survey for the week ending April 28, 2023.
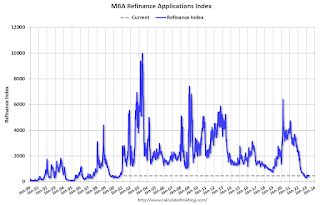
The Market Composite Index, a measure of mortgage loan application volume, decreased 1.2 percent on a seasonally adjusted basis from one week earlier. On an unadjusted basis, the Index decreased 0.4 percent compared with the previous week. The Refinance Index increased 1 percent from the previous week and was 51 percent lower than the same week one year ago. The seasonally adjusted Purchase Index decreased 2 percent from one week earlier. The unadjusted Purchase Index decreased 1 percent compared with the previous week and was 32 percent lower than the same week one year ago.
“Mortgage applications decreased last week, despite rates declining slightly for the first time in three weeks. The 30-year fixed rate decreased five basis points to 6.5 percent, which is still 114 basis points higher than a year ago,” said Joel Kan, MBA’s Vice President and Deputy Chief Economist. “Elevated rates continue to both impact homebuyer affordability and weaken demand for refinancing. Home purchase activity has been very sensitive to rates and local market trends, including the very low supply of existing-home inventory. However, newly constructed homes account for a growing share of inventory, giving more options for prospective buyers.”
Added Kan, “The jumbo-conforming spread continues to narrow, an indication that there is reduced lender appetite for jumbo loans following the recent turmoil in the banking sector and heightened concerns about liquidity. The spread was 13 basis points last week, after being as wide as 64 basis points in November 2022.”
..
The average contract interest rate for 30-year fixed-rate mortgages with conforming loan balances ($726,200 or less) decreased to 6.50 percent from 6.55 percent, with points remaining at 0.63 (including the origination fee) for 80 percent loan-to-value ratio (LTV) loans.
emphasis added
 Click on graph for larger image.
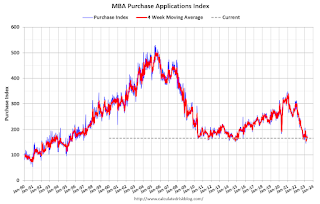
The first graph shows the MBA mortgage purchase index.
According to the MBA, purchase activity is down 32% year-over-year unadjusted.
Tuesday, May 02, 2023
Wednesday: FOMC Statement, ISM Services, ADP Employment, HVS Vacancies and Homeownership
by Calculated Risk on 5/02/2023 09:01:00 PM
Wednesday:
• At 7:00 AM ET, The Mortgage Bankers Association (MBA) will release the results for the mortgage purchase applications index.
• At 8:15 AM, The ADP Employment Report for April. This report is for private payrolls only (no government). The consensus is for 135,000 payroll jobs added in April, down from 145,000 added in March.
• At 10:00 AM, the Q1 2023 Housing Vacancies and Homeownership from the Census Bureau.
• Also at 10:00 AM, the ISM Services Index for April. The consensus is for a reading of 51.7, up from 51.2.
• At 2:00 PM, FOMC Meeting Announcement. The FOMC is expected to raise the Fed Funds rate by 25bp at this meeting and indicate a likely "pause" in June.
• At 2:30 PM, Fed Chair Jerome Powell holds a press briefing following the FOMC announcement.
Vehicles Sales at 15.91 million SAAR in April; Up 11.4% YoY
by Calculated Risk on 5/02/2023 06:17:00 PM
Wards Auto released their estimate of light vehicle sales for April: U.S. Light-Vehicle Sales Continue to Surprise on High Side (pay site).
Wards Auto estimates sales of 15.91 million SAAR in April 2023 (Seasonally Adjusted Annual Rate), up 7.4% from the March sales rate, and up 11.4% from April 2022.
 Click on graph for larger image.
This graph shows light vehicle sales since 2006 from the BEA (blue) and Wards Auto's estimate for April (red).
The impact of COVID-19 was significant, and April 2020 was the worst month. After April 2020, sales increased, and were close to sales in 2019 (the year before the pandemic). However, sales decreased in 2021 due to supply issues. The "supply chain bottom" was in September 2021.
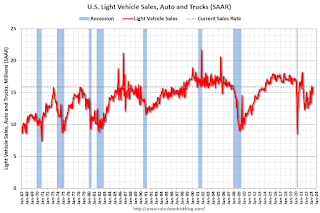 The second graph shows light vehicle sales since the BEA started keeping data in 1967.
 Sales in April were well above the consensus forecast.
Lawler: Invitation Homes Net Seller of Single-Family Properties for Second Straight Quarter
by Calculated Risk on 5/02/2023 03:30:00 PM
Today, in the Calculated Risk Real Estate Newsletter: Lawler: AMH Net Seller of Existing Single-Family Homes, “Investor” Home Purchases Plunged
Brief excerpt:
Housing economist Tom Lawler brings us some interesting data from Invitation Homes and also from several public builders:There is much more in the post. You can subscribe at https://calculatedrisk.substack.com/.
Invitation Homes Net Seller of SF Properties for Second Straight Quarter; Rent Growth Slows but Remains Elevated
Invitation Homes, the largest publicly-traded holder of single-family properties, reported that it disposed of slightly more single-family properties than it acquired last quarter, and that most of the small number of properties it acquired last quarter were from “builder partners.” According to its press release, Invitation Homes (including its joint ventures) acquired 197 SF properties in the quarter ended 3/31/2023 (of which 151 were from builder partners), and disposed of 297 SF properties. By comparison, in the previous quarter the company (including JVs) acquired 166 properties (81 from builder partners) and disposed of 199 SF properties. As a result, the company’s total SF rental property holdings declined for the second straight quarter last quarter. Here is a table showing acquisitions, dispositions, and total SF properties held by Invitation Homes (including joint ventures).
A Policy Proposal to Increase the Utilization of the Current Housing Stock
by Calculated Risk on 5/02/2023 02:04:00 PM
Today, in the Calculated Risk Real Estate Newsletter: A Policy Proposal to Increase the Utilization of the Current Housing Stock
A brief excerpt:
Here is a policy proposal that will likely help increase inventory in many areas (especially in high-cost areas) and would increase the utilization of the current housing stock.There is much more in the article. You can subscribe at https://calculatedrisk.substack.com/
BLS: Job Openings Decreased to 9.6 million in March
by Calculated Risk on 5/02/2023 10:06:00 AM
From the BLS: Job Openings and Labor Turnover Summary
The number of job openings decreased to 9.6 million on the last business day of March, the U.S. Bureau of Labor Statistics reported today. Over the month, the number of hires and total separations were little changed at 6.1 million and 5.9 million, respectively. Within separations, quits (3.9 million) changed little, while layoffs and discharges (1.8 million) increased.The following graph shows job openings (black line), hires (dark blue), Layoff, Discharges and other (red column), and Quits (light blue column) from the JOLTS.
emphasis added
This series started in December 2000.
Note: The difference between JOLTS hires and separations is similar to the CES (payroll survey) net jobs headline numbers. This report is for March the employment report this Friday will be for April.
 Click on graph for larger image.
Note that hires (dark blue) and total separations (red and light blue columns stacked) are usually pretty close each month. This is a measure of labor market turnover. When the blue line is above the two stacked columns, the economy is adding net jobs - when it is below the columns, the economy is losing jobs.
The spike in layoffs and discharges in March 2020 is labeled, but off the chart to better show the usual data.
Jobs openings decreased in March to 9.6 million from 10.0 million in February.
The number of job openings (black) were down 20% year-over-year.
Quits were down 14% year-over-year. These are voluntary separations. (See light blue columns at bottom of graph for trend for "quits").


