 RSS Feed
 by Calculated Risk on 5/05/2023 08:44:00 AM
Friday, May 05, 2023
April Employment Report: 253 thousand Jobs, 3.4% Unemployment Rate
From the BLS:
Total nonfarm payroll employment rose by 253,000 in April, and the unemployment rate changed little at 3.4 percent, the U.S. Bureau of Labor Statistics reported today. Employment continued to trend up in professional and business services, health care, leisure and hospitality, and social assistance.
...
The change in total nonfarm payroll employment for February was revised down by 78,000, from +326,000 to +248,000, and the change for March was revised down by 71,000, from +236,000 to +165,000. With these revisions, employment in February and March combined is 149,000 lower than previously reported.
emphasis added
 Click on graph for larger image.
The first graph shows the jobs added per month since January 2021.
Total payrolls increased by 253 thousand in April. Private payrolls increased by 230 thousand, and public payrolls increased 23 thousand.
Payrolls for February and January were revised down 149 thousand, combined.
Payrolls for February and January were revised down 149 thousand, combined.
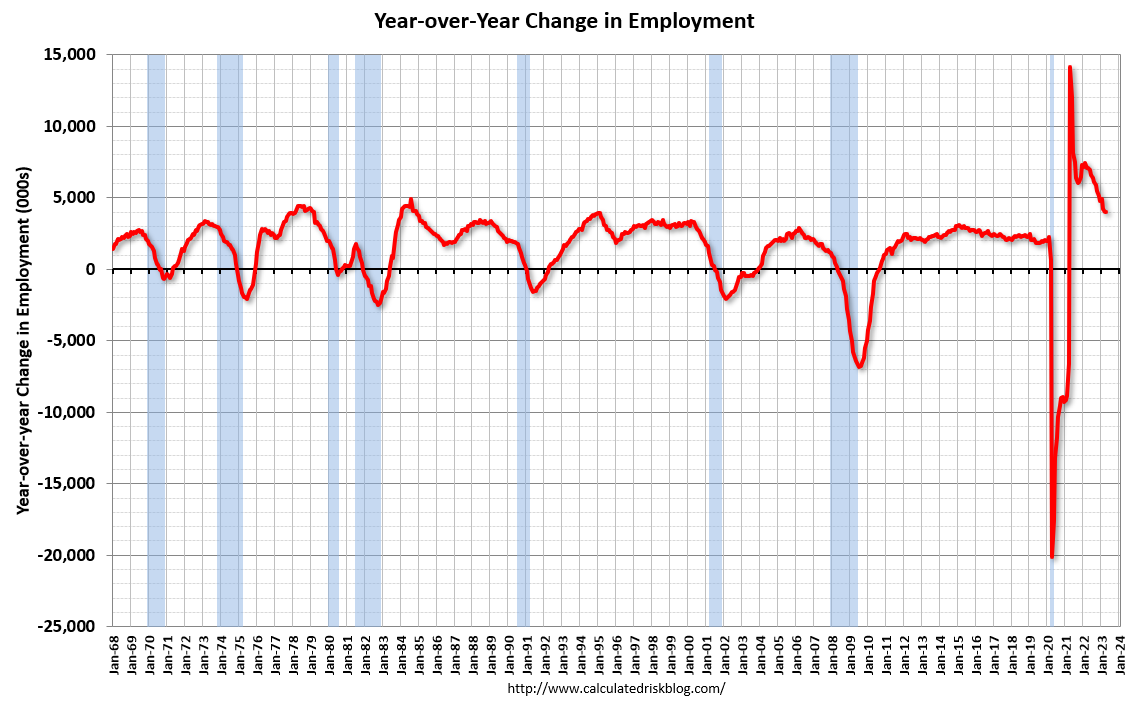 The second graph shows the year-over-year change in total non-farm employment since 1968.
In April, the year-over-year change was 4.00 million jobs. Employment was up significantly year-over-year.
The third graph shows the employment population ratio and the participation rate.
 The Labor Force Participation Rate was unchanged at 62.6% in April, from 62.6% in March. This is the percentage of the working age population in the labor force.
 The Employment-Population ratio was unchanged at 60.4% from 60.4% (blue line).
I'll post the 25 to 54 age group employment-population ratio graph later.
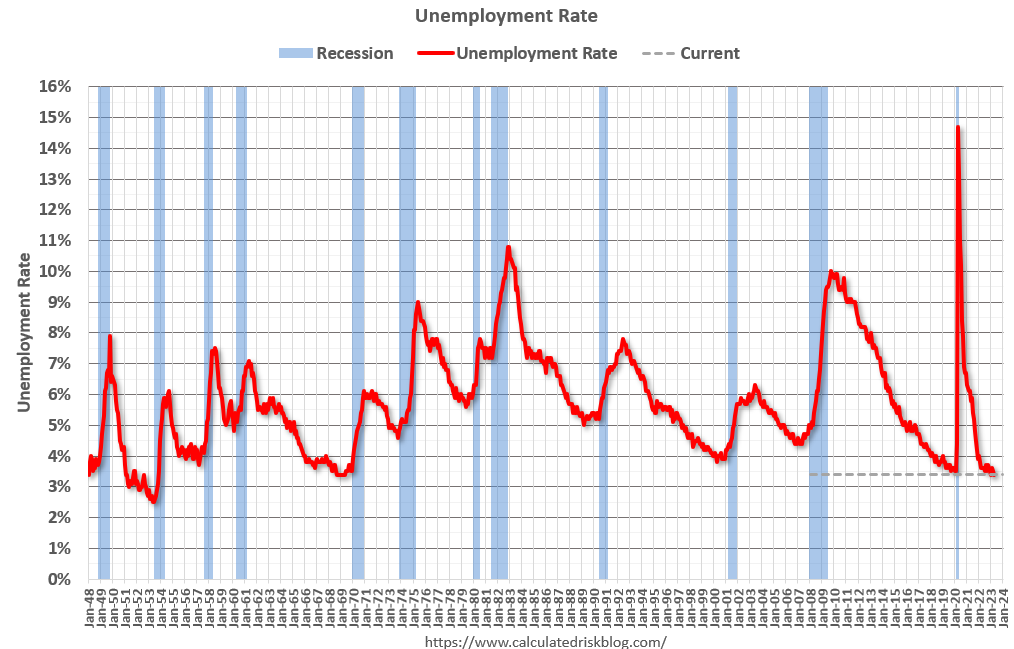 The fourth graph shows the unemployment rate.
 The unemployment rate decreased in April to 3.4% from 3.5% in March.
This was above consensus expectations; however, February and March payrolls were revised down by 149,000 combined.
Thursday, May 04, 2023
Friday: April Employment Report
by Calculated Risk on 5/04/2023 09:11:00 PM
 Note: Mortgage rates are from MortgageNewsDaily.com and are for top tier scenarios.
Friday:
• At 8:30 AM: Employment Report for April. The consensus is for 178,000 jobs added, and for the unemployment rate to increase to 3.6%.
Goldman April Payrolls Preview
by Calculated Risk on 5/04/2023 04:53:00 PM
A few brief excerpts from a note by Goldman Sachs economist Spencer Hill:
We estimate nonfarm payrolls rose 250k in April (mom sa), above consensus of +182k but a slowdown from the +345k average pace of the last three months. We believe high but falling labor demand more than offset continued layoffs in the information and financial sectors and a roughly 25k hiring drag from reduced credit availability. ... We estimate the unemployment rate was unchanged at 3.5% (vs. consensus 3.6%), reflecting a modest rise in household employment and unchanged labor force participation (at 62.6%).
emphasis added
Hotels: Occupancy Rate Up 0.1% Year-over-year
by Calculated Risk on 5/04/2023 02:59:00 PM
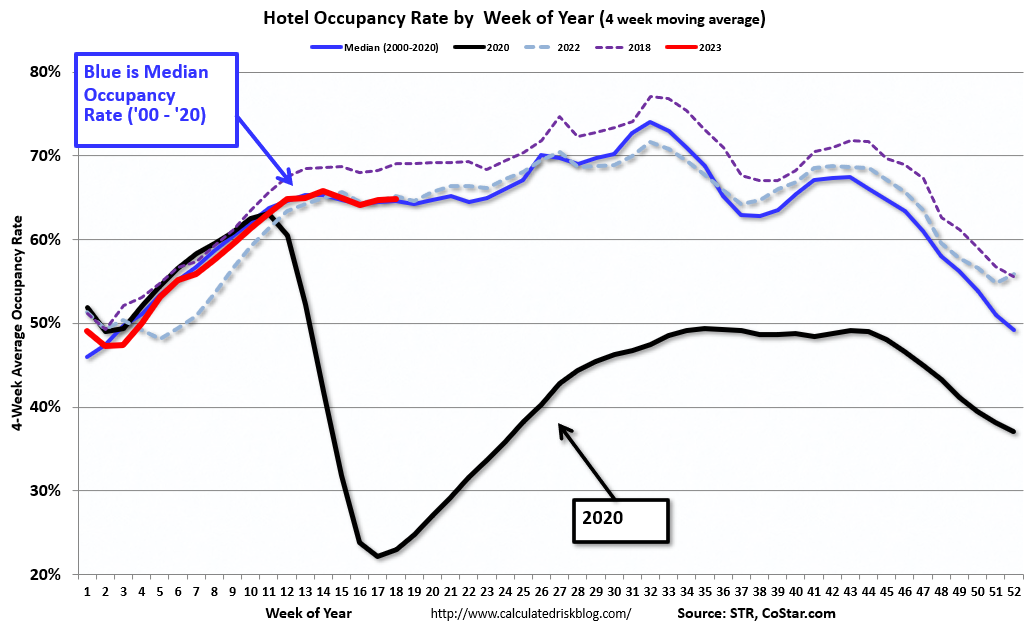
U.S. hotel performance showed mixed results from the previous week but remained up year over year, according to STR‘s latest data through April 29.The following graph shows the seasonal pattern for the hotel occupancy rate using the four-week average.
April 23-29, 2023 (percentage change from comparable week in 2022):
• Occupancy: 66.6% (+0.1%)
• Average daily rate (ADR): $156.14 (+5.5%)
• Revenue per available room (RevPAR): $104.01 (+5.6%)
emphasis added
 Click on graph for larger image.
The red line is for 2023, black is 2020, blue is the median, and dashed light blue is for 2022. Dashed purple is for 2018, the record year for hotel occupancy.
The 4-week average of the occupancy rate is close to the median rate for the period 2000 through 2020 (Blue).
Note: Y-axis doesn't start at zero to better show the seasonal change.
The 4-week average of the occupancy rate will move mostly sideways until the summer travel season.
April Employment Preview
by Calculated Risk on 5/04/2023 12:50:00 PM
On Friday at 8:30 AM ET, the BLS will release the employment report for April. The consensus is for 178,000 jobs added, and for the unemployment rate to increase to 3.6%.
From BofA economists:
"For the April employment report, we expect the data to show a moderation from red-hot hiring to strong hiring. We forecast nonfarm payroll growth of 200k. While this would signal that the pace of hiring is cooling, it would still mean hiring is exceeding the level needed to offset population growth (roughly 70k to 100k). Moreover, we look for the unemployment rate to remain unchanged at an astoundingly low level of 3.5%."From Goldman Sachs following the strong ADP report:
"We boosted our nonfarm payroll forecast by 25k to +250k (mom sa)."• ADP Report: The ADP employment report showed 296,000 private sector jobs were added in April. This suggests job gains well above consensus expectations, however, in general, ADP hasn't been very useful in forecasting the BLS report.
• ISM Surveys: Note that the ISM services are diffusion indexes based on the number of firms hiring (not the number of hires). The ISM® manufacturing employment index increased in April to 50.2%, up from 46.9% last month. This would suggest about 20,000 jobs lost in manufacturing. The ADP report indicated 38,000 manufacturing jobs lost in April.
The ISM® services employment index decreased in April to 50.8%, from 51.3% last month. This would suggest service employment increased 95,000 in April.
Combined, the ISM surveys suggest 75,000 jobs added in April (well below the consensus forecast).
• Unemployment Claims: The weekly claims report showed essentially no change in the number of initial unemployment claims during the reference week (includes the 12th of the month) from 247,000 in March to 245,000 in April. There has been a general increase in unemployment claims suggesting more layoffs recently.
• COVID: As far as the pandemic, the number of weekly cases during the reference week in March was around 102,000, down from 165,000 in March.
• Conclusion: a 178K report would be solid given the various indicators suggesting a slowdown in the economy. Some of the usual indicators - like the ISM reports and the unemployment claims - suggest a slowdown in job growth in April, although the ADP report suggests a pickup in employment. We've seen upside surprise in employment almost every month, however my sense is this report will be at or below the consensus.
Trade Deficit decreased to $64.2 Billion in March
by Calculated Risk on 5/04/2023 08:48:00 AM
The Census Bureau and the Bureau of Economic Analysis reported:
The U.S. Census Bureau and the U.S. Bureau of Economic Analysis announced today that the goods and services deficit was $64.2 billion in March, down $6.4 billion from $70.6 billion in February, revised.
March exports were $256.2 billion, $5.3 billion more than February exports. March imports were $320.4 billion, $1.1 billion less than February imports.
emphasis added
 Click on graph for larger image.
Exports increased and imports decreased in March.
Exports are up 5% year-over-year; imports are down 9% year-over-year.
Both imports and exports decreased sharply due to COVID-19 and then bounced back - but imports have been decreasing recently.
The second graph shows the U.S. trade deficit, with and without petroleum.
 The blue line is the total deficit, and the black line is the petroleum deficit, and the red line is the trade deficit ex-petroleum products.
Note that net, exports of petroleum products are positive and have picked up.
The trade deficit with China decreased to $16.6 billion in March, from $34.0 billion a year ago.
The trade deficit was close to the consensus forecast.
Weekly Initial Unemployment Claims increase to 242,000
by Calculated Risk on 5/04/2023 08:30:00 AM
The DOL reported:
In the week ending April 29, the advance figure for seasonally adjusted initial claims was 242,000, an increase of 13,000 from the previous week's revised level. The previous week's level was revised down by 1,000 from 230,000 to 229,000. The 4-week moving average was 239,250, an increase of 3,500 from the previous week's revised average. The previous week's average was revised down by 250 from 236,000 to 235,750.The following graph shows the 4-week moving average of weekly claims since 1971.
emphasis added
 Click on graph for larger image.
The dashed line on the graph is the current 4-week average. The four-week average of weekly unemployment claims increased to 239,250.
The previous week was revised down.
Weekly claims were close to the consensus forecast.
Wednesday, May 03, 2023
Thursday: Unemployment Claims, Trade Balance
by Calculated Risk on 5/03/2023 09:01:00 PM
 Note: Mortgage rates are from MortgageNewsDaily.com and are for top tier scenarios.
Thursday:
• At 8:30 AM ET, The initial weekly unemployment claims report will be released. The consensus is for 243 thousand initial claims, up from 230 thousand last week.
• At 8:30 AM, Trade Balance report for March from the Census Bureau. The consensus is the trade deficit to be $63.8 billion. The U.S. trade deficit was at $70.3 billion in February.
Heavy Truck Sales Up Sharply Year-over-year in April
by Calculated Risk on 5/03/2023 03:53:00 PM
The BEA released their estimate of vehicle sales for April this morning.
This graph shows heavy truck sales since 1967 using data from the BEA. The dashed line is the April 2023 seasonally adjusted annual sales rate (SAAR).
Heavy truck sales really collapsed during the great recession, falling to a low of 180 thousand SAAR in May 2009. Then heavy truck sales increased to a new all-time high of 570 thousand SAAR in April 2019.
 Click on graph for larger image.
Note: "Heavy trucks - trucks more than 14,000 pounds gross vehicle weight."
Heavy truck sales declined sharply at the beginning of the pandemic, falling to a low of 308 thousand SAAR in May 2020.
Heavy truck sales were at 563 thousand SAAR in April, up from 486 thousand in March, and up 23% from 456 thousand SAAR in April 2022.
Usually, heavy truck sales decline sharply prior to a recession. Sales were strong in April.
FOMC Statement: Raise Rates 25 bp; Pause in June Likely
by Calculated Risk on 5/03/2023 02:02:00 PM
Fed Chair Powell press conference video here or on YouTube here, starting at 2:30 PM ET.
FOMC Statement:
Economic activity expanded at a modest pace in the first quarter. Job gains have been robust in recent months, and the unemployment rate has remained low. Inflation remains elevated.
The U.S. banking system is sound and resilient. Tighter credit conditions for households and businesses are likely to weigh on economic activity, hiring, and inflation. The extent of these effects remains uncertain. The Committee remains highly attentive to inflation risks.
The Committee seeks to achieve maximum employment and inflation at the rate of 2 percent over the longer run. In support of these goals, the Committee decided to raise the target range for the federal funds rate to 5 to 5-1/4 percent. The Committee will closely monitor incoming information and assess the implications for monetary policy. In determining the extent to which additional policy firming may be appropriate to return inflation to 2 percent over time, the Committee will take into account the cumulative tightening of monetary policy, the lags with which monetary policy affects economic activity and inflation, and economic and financial developments. In addition, the Committee will continue reducing its holdings of Treasury securities and agency debt and agency mortgage-backed securities, as described in its previously announced plans. The Committee is strongly committed to returning inflation to its 2 percent objective.
In assessing the appropriate stance of monetary policy, the Committee will continue to monitor the implications of incoming information for the economic outlook. The Committee would be prepared to adjust the stance of monetary policy as appropriate if risks emerge that could impede the attainment of the Committee's goals. The Committee's assessments will take into account a wide range of information, including readings on labor market conditions, inflation pressures and inflation expectations, and financial and international developments.
Voting for the monetary policy action were Jerome H. Powell, Chair; John C. Williams, Vice Chair; Michael S. Barr; Michelle W. Bowman; Lisa D. Cook; Austan D. Goolsbee; Patrick Harker; Philip N. Jefferson; Neel Kashkari; Lorie K. Logan; and Christopher J. Waller.
emphasis added


