 RSS Feed
 by Calculated Risk on 5/05/2023 01:46:00 PM
Friday, May 05, 2023
Wholesale Used Car Prices Decreased in April; Down 4.4% Year-over-year
From Manheim Consulting today: Wholesale Used-Vehicle Prices See Sizable Decline in April
Wholesale used-vehicle prices (on a mix, mileage, and seasonally adjusted basis) decreased 3.0% in April from March. The Manheim Used Vehicle Value Index (MUVVI) dropped to 230.8, down 4.4% from a year ago.
“While values increased 8.6% through the first quarter from December, the market has reversed course in April, with our monthly figures showing a month-over-month decline for the first time in 2023,” said Chris Frey, senior manager of Economic and Industry Insights for Cox Automotive. “Values in April also continue to be lower year over year. We’ve experienced eight straight months of year-over-year declines, averaging 8.3%, and it’s likely not over yet. During the financial crisis, we had 16 months of annualized declines, averaging 5.8%. Though I’m not predicting doom, we’ve surely started a second, and more rapid, decent off the pandemic peak of January 2022.”
emphasis added
 Click on graph for larger image.
This index from Manheim Consulting is based on all completed sales transactions at Manheim’s U.S. auctions.
The Manheim index suggests used car prices decreased in April (seasonally adjusted) and were down 4.4% year-over-year (YoY).
Early Look at Local Housing Markets in April
by Calculated Risk on 5/05/2023 10:36:00 AM
Today, in the Calculated Risk Real Estate Newsletter: Early Look at Local Housing Markets in April
A brief excerpt:
This is a look at a few early reporting local markets in April. I’m tracking about 40 local housing markets in the US. Some of the 40 markets are states, and some are metropolitan areas. I’ll update these tables throughout the month as additional data is released.There is much more in the article. You can subscribe at https://calculatedrisk.substack.com/
Closed sales in April were mostly for contracts signed in February and March. Since 30-year fixed mortgage rates were over 6% for all of February and March - compared to the 4% range the previous year - closed sales were down significantly year-over-year in April.
It is likely sales were down more year-over-year in April than in March, however, the impact was probably not as severe as for closed sales in December and January (rates were the highest in October and November 2022 when contracts were signed for closing in December and January).
...
In April, sales in these markets were down 34.5%. In March, these same markets were down 26.5% YoY Not Seasonally Adjusted (NSA).
This is a larger YoY decline NSA than in March for these early reporting markets, however there was one less selling day in April this year. This early data suggests the April existing home sales report will show another significant YoY decline, and the 20th consecutive month with a YoY decline in sales.
This was a just a few early reporting markets. Many more local markets to come!

Comments on April Employment Report
by Calculated Risk on 5/05/2023 09:23:00 AM
The headline jobs number in the April employment report was above expectations, however employment for the previous two months was revised down by 149,000, combined. The participation rate and employment population ratio were unchanged, and the unemployment rate decreased to 3.4%.
This is the lowest unemployment rate since 1969 (over 50 years ago), and the unemployment rate hasn't been lower since 1953! (70 years ago).
In April, the year-over-year employment change was 4.00 million jobs.
Prime (25 to 54 Years Old) Participation
 Since the overall participation rate is impacted by both cyclical (recession) and demographic (aging population, younger people staying in school) reasons, here is the employment-population ratio for the key working age group: 25 to 54 years old.
The 25 to 54 participation rate was increased in April to 83.3% from 83.1% in March, and the 25 to 54 employment population ratio increased to 80.8% from 80.7% the previous month.
Leisure and hospitality gained 31 thousand jobs in March. At the beginning of the pandemic, in March and April of 2020, leisure and hospitality lost 8.2 million jobs, and are now down 402 thousand jobs since February 2020. So, leisure and hospitality has now added back about 95% all of the jobs lost in March and April 2020.
Construction employment increased 15 thousand and is now 295 thousand above the pre-pandemic level.
Manufacturing employment increased 11 thousand jobs and is now 206 thousand above the pre-pandemic level.
In April, the year-over-year employment change was 4.00 million jobs.
Prime (25 to 54 Years Old) Participation
 Since the overall participation rate is impacted by both cyclical (recession) and demographic (aging population, younger people staying in school) reasons, here is the employment-population ratio for the key working age group: 25 to 54 years old.
The 25 to 54 participation rate was increased in April to 83.3% from 83.1% in March, and the 25 to 54 employment population ratio increased to 80.8% from 80.7% the previous month.
Both are slightly above the pre-pandemic levels and suggest all of the prime age workers have returned to the labor force.
Average Hourly Wages
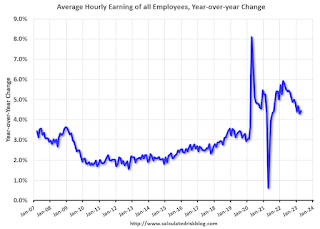 The graph shows the nominal year-over-year change in "Average Hourly Earnings" for all private employees from the Current Employment Statistics (CES).
Average Hourly Wages
 The graph shows the nominal year-over-year change in "Average Hourly Earnings" for all private employees from the Current Employment Statistics (CES).
 There was a huge increase at the beginning of the pandemic as lower paid employees were let go, and then the pandemic related spike reversed a year later.
Wage growth has trended down after peaking at 5.9% YoY in March 2022 and was at 4.4% YoY in April.
Wage growth has trended down after peaking at 5.9% YoY in March 2022 and was at 4.4% YoY in April.
Year-over-year wage growth will likely slow further over the next few months.
Part Time for Economic Reasons
 From the BLS report:
These workers are included in the alternate measure of labor underutilization (U-6) that decreased to 6.6% from 6.7% in the previous month. This is down from the record high in April 22.9% and up slightly from the lowest level on record (seasonally adjusted) in December 2022 (6.5%). (This series started in 1994). This measure is below the level in February 2020 (pre-pandemic).
Unemployed over 26 Weeks
 This graph shows the number of workers unemployed for 27 weeks or more.
According to the BLS, there are 1.156 million workers who have been unemployed for more than 26 weeks and still want a job, up from 1.104 million the previous month.
This is at pre-pandemic levels.
Summary:
The headline monthly jobs number was above expectations; however, employment for the previous two months was revised down by 149,000, combined. The headline unemployment rate decreased to 3.4% - the lowest in over 50 years!
Part Time for Economic Reasons
 From the BLS report:
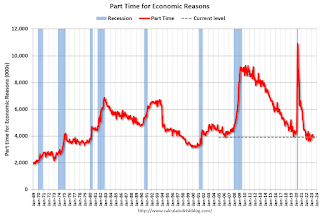
"The number of persons employed part time for economic reasons, at 3.9 million, was little changed in April. These individuals, who would have preferred full-time employment, were working part time because their hours had been reduced or they were unable to find full-time jobs."The number of persons working part time for economic reasons decreased in April to 3.903 million from 4.102 million in March. This is below pre-recession levels.
These workers are included in the alternate measure of labor underutilization (U-6) that decreased to 6.6% from 6.7% in the previous month. This is down from the record high in April 22.9% and up slightly from the lowest level on record (seasonally adjusted) in December 2022 (6.5%). (This series started in 1994). This measure is below the level in February 2020 (pre-pandemic).
Unemployed over 26 Weeks
 This graph shows the number of workers unemployed for 27 weeks or more.
 According to the BLS, there are 1.156 million workers who have been unemployed for more than 26 weeks and still want a job, up from 1.104 million the previous month.
This is at pre-pandemic levels.
Summary:
The headline monthly jobs number was above expectations; however, employment for the previous two months was revised down by 149,000, combined. The headline unemployment rate decreased to 3.4% - the lowest in over 50 years!
Overall this was another solid employment report, however, including the substantial downward revisions, this employment report was weaker than expected.
April Employment Report: 253 thousand Jobs, 3.4% Unemployment Rate
by Calculated Risk on 5/05/2023 08:44:00 AM
From the BLS:
Total nonfarm payroll employment rose by 253,000 in April, and the unemployment rate changed little at 3.4 percent, the U.S. Bureau of Labor Statistics reported today. Employment continued to trend up in professional and business services, health care, leisure and hospitality, and social assistance.
...
The change in total nonfarm payroll employment for February was revised down by 78,000, from +326,000 to +248,000, and the change for March was revised down by 71,000, from +236,000 to +165,000. With these revisions, employment in February and March combined is 149,000 lower than previously reported.
emphasis added
 Click on graph for larger image.
The first graph shows the jobs added per month since January 2021.
Total payrolls increased by 253 thousand in April. Private payrolls increased by 230 thousand, and public payrolls increased 23 thousand.
Payrolls for February and January were revised down 149 thousand, combined.
Payrolls for February and January were revised down 149 thousand, combined.
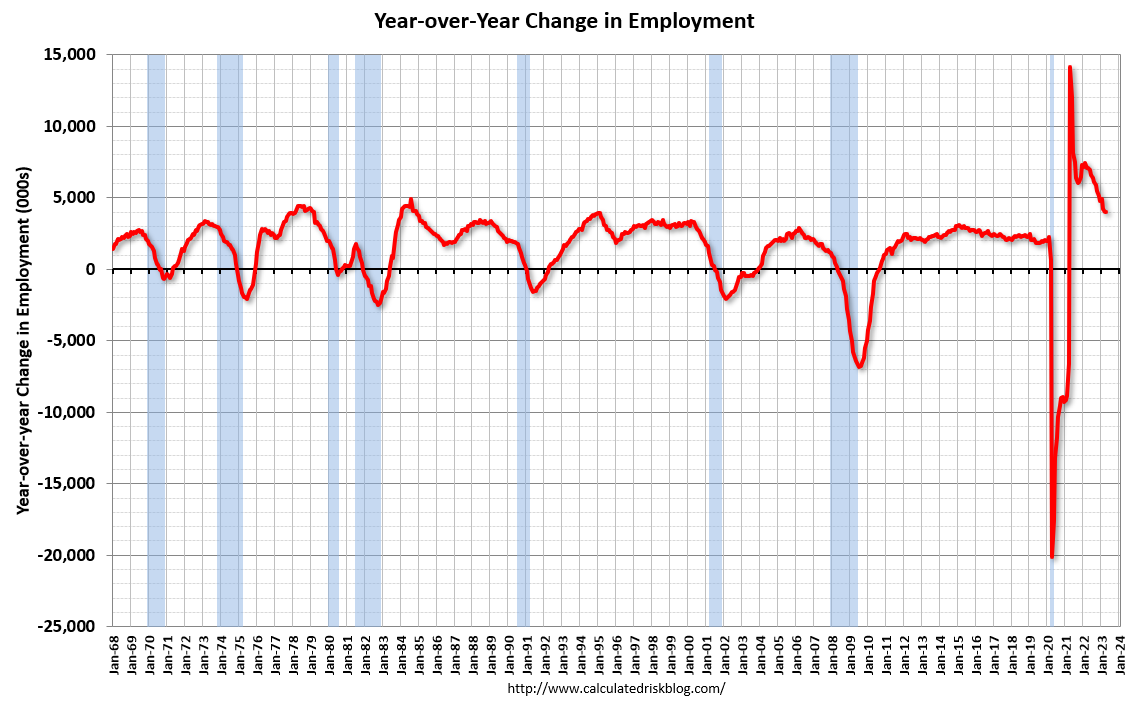 The second graph shows the year-over-year change in total non-farm employment since 1968.
In April, the year-over-year change was 4.00 million jobs. Employment was up significantly year-over-year.
The third graph shows the employment population ratio and the participation rate.
 The Labor Force Participation Rate was unchanged at 62.6% in April, from 62.6% in March. This is the percentage of the working age population in the labor force.
 The Employment-Population ratio was unchanged at 60.4% from 60.4% (blue line).
I'll post the 25 to 54 age group employment-population ratio graph later.
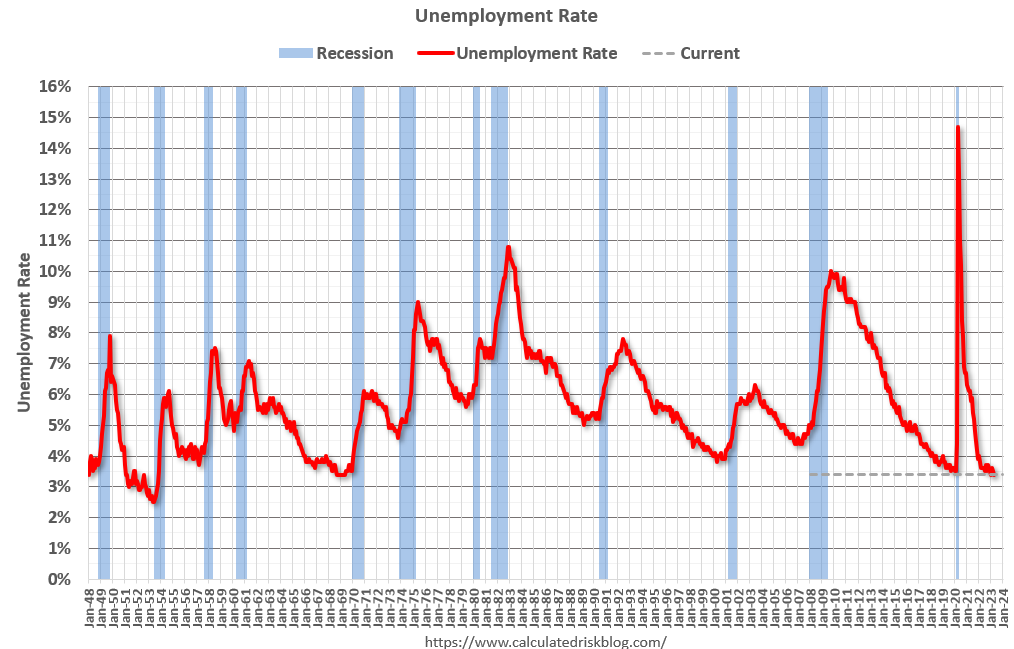 The fourth graph shows the unemployment rate.
 The unemployment rate decreased in April to 3.4% from 3.5% in March.
This was above consensus expectations; however, February and March payrolls were revised down by 149,000 combined.
Thursday, May 04, 2023
Friday: April Employment Report
by Calculated Risk on 5/04/2023 09:11:00 PM
 Note: Mortgage rates are from MortgageNewsDaily.com and are for top tier scenarios.
Friday:
• At 8:30 AM: Employment Report for April. The consensus is for 178,000 jobs added, and for the unemployment rate to increase to 3.6%.
Goldman April Payrolls Preview
by Calculated Risk on 5/04/2023 04:53:00 PM
A few brief excerpts from a note by Goldman Sachs economist Spencer Hill:
We estimate nonfarm payrolls rose 250k in April (mom sa), above consensus of +182k but a slowdown from the +345k average pace of the last three months. We believe high but falling labor demand more than offset continued layoffs in the information and financial sectors and a roughly 25k hiring drag from reduced credit availability. ... We estimate the unemployment rate was unchanged at 3.5% (vs. consensus 3.6%), reflecting a modest rise in household employment and unchanged labor force participation (at 62.6%).
emphasis added
Hotels: Occupancy Rate Up 0.1% Year-over-year
by Calculated Risk on 5/04/2023 02:59:00 PM
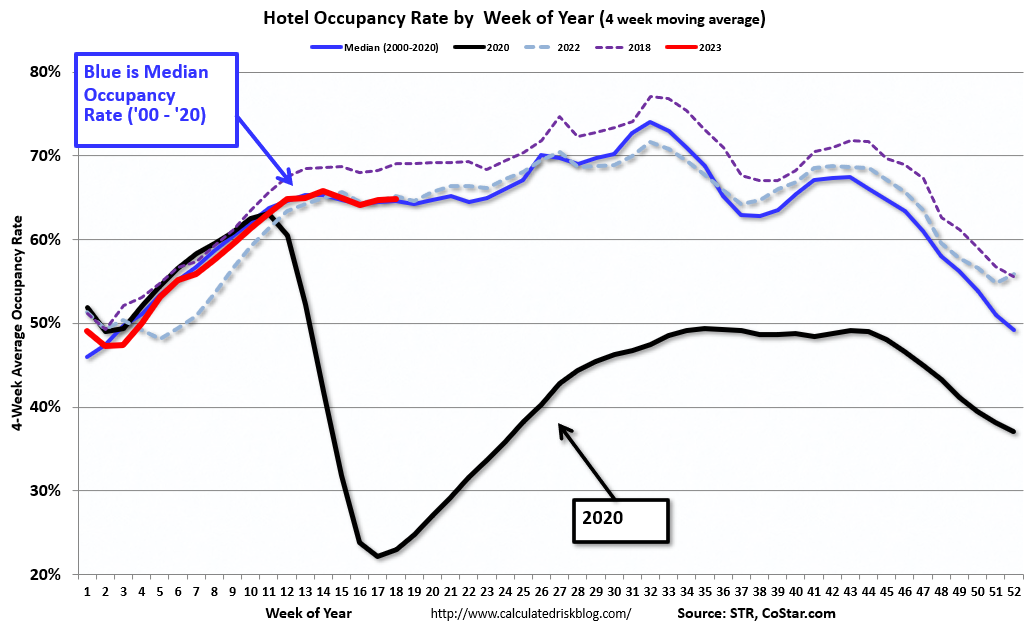
U.S. hotel performance showed mixed results from the previous week but remained up year over year, according to STR‘s latest data through April 29.The following graph shows the seasonal pattern for the hotel occupancy rate using the four-week average.
April 23-29, 2023 (percentage change from comparable week in 2022):
• Occupancy: 66.6% (+0.1%)
• Average daily rate (ADR): $156.14 (+5.5%)
• Revenue per available room (RevPAR): $104.01 (+5.6%)
emphasis added
 Click on graph for larger image.
The red line is for 2023, black is 2020, blue is the median, and dashed light blue is for 2022. Dashed purple is for 2018, the record year for hotel occupancy.
The 4-week average of the occupancy rate is close to the median rate for the period 2000 through 2020 (Blue).
Note: Y-axis doesn't start at zero to better show the seasonal change.
The 4-week average of the occupancy rate will move mostly sideways until the summer travel season.
April Employment Preview
by Calculated Risk on 5/04/2023 12:50:00 PM
On Friday at 8:30 AM ET, the BLS will release the employment report for April. The consensus is for 178,000 jobs added, and for the unemployment rate to increase to 3.6%.
From BofA economists:
"For the April employment report, we expect the data to show a moderation from red-hot hiring to strong hiring. We forecast nonfarm payroll growth of 200k. While this would signal that the pace of hiring is cooling, it would still mean hiring is exceeding the level needed to offset population growth (roughly 70k to 100k). Moreover, we look for the unemployment rate to remain unchanged at an astoundingly low level of 3.5%."From Goldman Sachs following the strong ADP report:
"We boosted our nonfarm payroll forecast by 25k to +250k (mom sa)."• ADP Report: The ADP employment report showed 296,000 private sector jobs were added in April. This suggests job gains well above consensus expectations, however, in general, ADP hasn't been very useful in forecasting the BLS report.
• ISM Surveys: Note that the ISM services are diffusion indexes based on the number of firms hiring (not the number of hires). The ISM® manufacturing employment index increased in April to 50.2%, up from 46.9% last month. This would suggest about 20,000 jobs lost in manufacturing. The ADP report indicated 38,000 manufacturing jobs lost in April.
The ISM® services employment index decreased in April to 50.8%, from 51.3% last month. This would suggest service employment increased 95,000 in April.
Combined, the ISM surveys suggest 75,000 jobs added in April (well below the consensus forecast).
• Unemployment Claims: The weekly claims report showed essentially no change in the number of initial unemployment claims during the reference week (includes the 12th of the month) from 247,000 in March to 245,000 in April. There has been a general increase in unemployment claims suggesting more layoffs recently.
• COVID: As far as the pandemic, the number of weekly cases during the reference week in March was around 102,000, down from 165,000 in March.
• Conclusion: a 178K report would be solid given the various indicators suggesting a slowdown in the economy. Some of the usual indicators - like the ISM reports and the unemployment claims - suggest a slowdown in job growth in April, although the ADP report suggests a pickup in employment. We've seen upside surprise in employment almost every month, however my sense is this report will be at or below the consensus.
Trade Deficit decreased to $64.2 Billion in March
by Calculated Risk on 5/04/2023 08:48:00 AM
The Census Bureau and the Bureau of Economic Analysis reported:
The U.S. Census Bureau and the U.S. Bureau of Economic Analysis announced today that the goods and services deficit was $64.2 billion in March, down $6.4 billion from $70.6 billion in February, revised.
March exports were $256.2 billion, $5.3 billion more than February exports. March imports were $320.4 billion, $1.1 billion less than February imports.
emphasis added
 Click on graph for larger image.
Exports increased and imports decreased in March.
Exports are up 5% year-over-year; imports are down 9% year-over-year.
Both imports and exports decreased sharply due to COVID-19 and then bounced back - but imports have been decreasing recently.
The second graph shows the U.S. trade deficit, with and without petroleum.
 The blue line is the total deficit, and the black line is the petroleum deficit, and the red line is the trade deficit ex-petroleum products.
Note that net, exports of petroleum products are positive and have picked up.
The trade deficit with China decreased to $16.6 billion in March, from $34.0 billion a year ago.
The trade deficit was close to the consensus forecast.
Weekly Initial Unemployment Claims increase to 242,000
by Calculated Risk on 5/04/2023 08:30:00 AM
The DOL reported:
In the week ending April 29, the advance figure for seasonally adjusted initial claims was 242,000, an increase of 13,000 from the previous week's revised level. The previous week's level was revised down by 1,000 from 230,000 to 229,000. The 4-week moving average was 239,250, an increase of 3,500 from the previous week's revised average. The previous week's average was revised down by 250 from 236,000 to 235,750.The following graph shows the 4-week moving average of weekly claims since 1971.
emphasis added
 Click on graph for larger image.
The dashed line on the graph is the current 4-week average. The four-week average of weekly unemployment claims increased to 239,250.
The previous week was revised down.
Weekly claims were close to the consensus forecast.


