 RSS Feed
 by Calculated Risk on 5/08/2023 02:08:00 PM
Monday, May 08, 2023
Fed Survey: Banks reported Tighter Standards, Weaker Demand for All Loan Types
From the Federal Reserve: The April 2023 Senior Loan Officer Opinion Survey on Bank Lending Practices
The April 2023 Senior Loan Officer Opinion Survey on Bank Lending Practices (SLOOS) addressed changes in the standards and terms on, and demand for, bank loans to businesses and households over the past three months, which generally correspond to the first quarter of 2023.
Regarding loans to businesses, survey respondents reported, on balance, tighter standards and weaker demand for commercial and industrial (C&I) loans to large and middle-market firms as well as small firms over the first quarter. Meanwhile, banks reported tighter standards and weaker demand for all commercial real estate (CRE) loan categories.
For loans to households, banks reported that lending standards tightened across all categories of residential real estate (RRE) loans other than government-sponsored enterprise (GSE)-eligible and government residential mortgages, which remained basically unchanged. Meanwhile, demand weakened for all RRE loan categories. In addition, banks reported tighter standards and weaker demand for home equity lines of credit (HELOCs). Standards tightened for all consumer loan categories; demand weakened for auto and other consumer loans, while it remained basically unchanged for credit cards.
emphasis added
 Click on graph for larger image.
This graph on Residential Real Estate demand is from the Senior Loan Officer Survey Charts.
This shows that demand has declined.
The left graph is 1990 to 2014. The right graph is 2015 to Q1 2023.
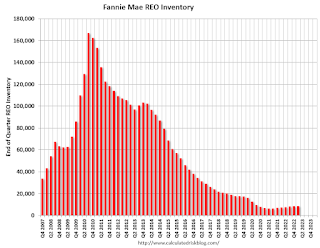
Fannie "Real Estate Owned" inventory essentially unchanged in Q1
by Calculated Risk on 5/08/2023 12:02:00 PM
Fannie reported results for Q1 2023. Here is some information on single-family Real Estate Owned (REOs).
Fannie Mae reported the number of REOs increased to 8,780 at the end of Q1 2023, essentially unchanged from 8,779 in Q4 2022, and up 18% from 7,430 at the end of Q1 2022.
For Fannie, this is down 95% from the 166,787 peak number of REOs in Q3 2010.
 Click on graph for larger image.
Here is a graph of Fannie Real Estate Owned (REO).
This is well below a normal level of REOs for Fannie, and REO levels will increase further in 2023, but there will not be a huge wave of foreclosures.
 Click on graph for larger image.
Here is a graph of Fannie Real Estate Owned (REO).
This is well below a normal level of REOs for Fannie, and REO levels will increase further in 2023, but there will not be a huge wave of foreclosures.
Lawler: American Homes 4 Rent Net Seller of Single-Family Homes Last Quarter
by Calculated Risk on 5/08/2023 09:46:00 AM
Today, in the Calculated Risk Real Estate Newsletter: Lawler: American Homes 4 Rent Net Seller of Single-Family Homes Last Quarter
Brief excerpt:
Housing economist Tom Lawler brings us some interesting data from American Homes 4 Rent. Last week, Lawler discussed Invitation Homes Net Seller of Single-Family Properties for Second Straight Quarter and also provided statistics from eight public builders):There is much more in the post. You can subscribe at https://calculatedrisk.substack.com/.
American Homes 4 Rent Net Seller of Single-Family Homes Last Quarter; Rent Growth Slowed but Remained Elevated
American Homes 4 Rent (AMH), a publicly-traded company in the single-family rental business with over 58,000 SF rental properties, reported that it disposed of 354 more SF properties than it acquired last quarter, and excluding deliveries of build-to-rent homes from its own AMH Development Program its net sales of SF properties totaled 653 properties. Below is a table showing AMH’s acquisitions, dispositions, and total wholly-owned SF properties.

Housing May 8th Weekly Update: Inventory Decreased 0.6% Week-over-week
by Calculated Risk on 5/08/2023 08:11:00 AM
Altos reports that active single-family inventory was down 0.6% week-over-week.
 Click on graph for larger image.
This inventory graph is courtesy of Altos Research.
As of May 5th, inventory was at 420 thousand (7-day average), compared to 422 thousand the prior week.
Year-to-date, inventory is down 14.5%. And inventory is up 3.5% from the bottom three weeks ago.

The red line is for 2023. The black line is for 2019. Note that inventory is up from the previous two years (the record low was in 2022), but still well below normal levels.
Inventory was up 39.7% compared to the same week in 2022 (last week it was up 46.7%), and down 52.6% compared to the same week in 2019 (last week down 52.3%).
Mike Simonsen discusses this data regularly on Youtube.
Sunday, May 07, 2023
Monday: Senior Loan Officer Opinion Survey on Bank Lending Practices
by Calculated Risk on 5/07/2023 11:53:00 PM
Weekend:
• Schedule for Week of May 7, 2023
Monday:
• At 2:00 PM ET Senior Loan Officer Opinion Survey on Bank Lending Practices for April.
From CNBC: Pre-Market Data and Bloomberg futures S&P 500 and DOW futures are down slightly (fair value).
Oil prices were down over the last week with WTI futures at $71.34 per barrel and Brent at $75.30 per barrel. A year ago, WTI was at $110, and Brent was at $114 - so WTI oil prices are down about 35% year-over-year.
Here is a graph from Gasbuddy.com for nationwide gasoline prices. Nationally prices are at $3.50 per gallon. A year ago, prices were at $4.28 per gallon, so gasoline prices are down $0.78 per gallon year-over-year.
Realtor.com Reports Weekly Active Inventory Up 35% YoY; New Listings Down 22% YoY
by Calculated Risk on 5/07/2023 09:32:00 AM
Realtor.com has monthly and weekly data on the existing home market. Here is their weekly report from chief economist Danielle Hale: Weekly Housing Trends View — Data Week Ending Apr 29, 2023
• Active inventory was up at a slower pace, with for-sale homes up just 35% above one year ago. The number of homes for sale continues to grow, but compared to one year ago, the pace is slowing.
...
• New listings–a measure of sellers putting homes up for sale–were down again this week, by 22% from one year ago. The number of newly listed homes has been lower than the same time the previous year for the past 43 weeks.
 Here is a graph of the year-over-year change in inventory according to realtor.com.
 Inventory is still up year-over-year - from record lows - however, the YoY increase has slowed sharply recently.
This was the smallest YoY increase since October.
The recent trend suggests active inventory could be down YoY in Q3!
Saturday, May 06, 2023
Real Estate Newsletter Articles this Week: Year-over-year Rent Growth Continues to Decelerate
by Calculated Risk on 5/06/2023 02:11:00 PM
At the Calculated Risk Real Estate Newsletter this week:
• Year-over-year Rent Growth Continues to Decelerate
• Lawler: Invitation Homes Net Seller of Single-Family Properties for Second Straight Quarter
• A Policy Proposal to Increase the Utilization of the Current Housing Stock
• Black Knight Mortgage Monitor: Home Prices Increased in March; Prices Up 1.0% YoY
• Early Look at Local Housing Markets in April
This is usually published 4 to 6 times a week and provides more in-depth analysis of the housing market.
You can subscribe at https://calculatedrisk.substack.com/
Most content is available for free (and no Ads), but please subscribe!
Schedule for Week of May 7, 2023
by Calculated Risk on 5/06/2023 08:11:00 AM
The key report this week is April CPI.
Note: The Fed will release the Senior Loan Officer Opinion Survey on Bank Lending Practices (SLOOS) on Monday. This will provide some information on recent credit tightening.
2:00 PM: Senior Loan Officer Opinion Survey on Bank Lending Practices for April.
6:00 AM ET: NFIB Small Business Optimism Index for April.
7:00 AM ET: The Mortgage Bankers Association (MBA) will release the results for the mortgage purchase applications index.
8:30 AM: The Consumer Price Index for April from the BLS. The consensus is for 0.4% increase in CPI (up 5.0% YoY), and a 0.3% increase in core CPI (up 5.5% YoY).
8:30 AM: The initial weekly unemployment claims report will be released. The consensus is for 250 thousand initial claims, up from 242 thousand last week.
8:30 AM: The Producer Price Index for April from the BLS. The consensus is for a 0.3% increase in PPI, and a 0.3% increase in core PPI.
10:00 AM: University of Michigan's Consumer sentiment index (Preliminary for May).
Friday, May 05, 2023
COVID May 5, 2023, Update: New Pandemic Low for Hospitalizations
by Calculated Risk on 5/05/2023 09:04:00 PM
 Note: Mortgage rates are from MortgageNewsDaily.com and are for top tier scenarios.
On COVID (focus on hospitalizations and deaths). Data is now weekly.
After the first few weeks, the pandemic low for weekly deaths had been the week of July 7, 2021, at 1,690 deaths (until recently).
For cases, the low was 82,186 (getting close).
For COVID hospitalizations, the low was 9,821 (until this week).
| COVID Metrics | ||||
|---|---|---|---|---|
| Now | Week Ago | Goal | ||
| New Cases per Week2 | 77,924 | 90,318 | ≤35,0001 | |
| Hospitalized2 | 8,861 | 10,214 | ≤3,0001 | |
| Deaths per Week2🚩 | 1,109 | 1,049 | ≤3501 | |
| 1my goals to stop weekly posts, 2Weekly for Cases, Currently Hospitalized, and Deaths 🚩 Increasing number weekly for Cases, Hospitalized, and Deaths ✅ Goal met. | ||||
 Click on graph for larger image.
This graph shows the weekly (columns) number of deaths reported.
Weekly deaths increased slightly this week, just up from the pandemic low of 1,049 deaths the previous week.
AAR: April Rail Carloads Increased, Intermodal Decreased Year-over-year
by Calculated Risk on 5/05/2023 03:01:00 PM
From the Association of American Railroads (AAR) Rail Time Indicators. Graphs and excerpts reprinted with permission.
Rail intermodal continues to struggle. U.S. intermodal volume was 12.7% lower in April 2023 than in April 2022. April’s decline was the 14th straight and 20th in the past 21 months. In 2023 through April, volume was 3.97 million containers and trailers, down 10.9% (484,228) from last year and the fewest for January to April since 2012. Year-to-date container volume was down 9.5%; trailer volume was down 28.3%. Trailers accounted for 5.8% of intermodal units In the first four months of 2023, a record low.
Meanwhile, carloads were better: total originated carloads on U.S. railroads in April were up 1.8% over April 2022 and averaged 234,159 per week — the most in six months. Year-to-date total carloads were 3.93 million, up 0.6% over the first four months of 2022 and the most for January to April since 2019.
emphasis added
 Click on graph for larger image.
This graph from the Rail Time Indicators report shows the six-week average of U.S. Carloads in 2021, 2022 and 2022:
Originated carloads on U.S. railroads in April 2023 totaled 936,637, up 1.8% over April 2022. Total carloads averaged 234,159 per week in April 2023, the most in six months.
For the first four months of 2023, total carloads were 3.93 million, up 0.6% (23,161 carloads) over the first four months of 2022 and the most for January to April since 2019.
 The second graph shows the six-week average (not monthly) of U.S. intermodal in 2021, 2022 and 2023: (using intermodal or shipping containers):
U.S. railroads originated 945,313 intermodal containers and trailers in April 2023, down 12.7% (137,879 units) from April 2022. April’s decline was the 14th straight for intermodal. Originations averaged 236,328 units per week in April 2023, the most in five months.
In 2023 through April, intermodal volume was 3.97 million units, down 10.9% (484,228) from last year and the fewest for January to April since 2012.


