 RSS Feed
 by Calculated Risk on 5/10/2023 11:27:00 AM
Wednesday, May 10, 2023
Cleveland Fed: Median CPI increased 0.4% and Trimmed-mean CPI increased 0.3% in April
The Cleveland Fed released the median CPI and the trimmed-mean CPI.
According to the Federal Reserve Bank of Cleveland, the median Consumer Price Index rose 0.4% in April. The 16% trimmed-mean Consumer Price Index increased 0.3% in April. "The median CPI and 16% trimmed-mean CPI are measures of core inflation calculated by the Federal Reserve Bank of Cleveland based on data released in the Bureau of Labor Statistics’ (BLS) monthly CPI report".
 Click on graph for larger image.
This graph shows the year-over-year change for these four key measures of inflation.
On a year-over-year basis, the median CPI rose 7.0%, the trimmed-mean CPI rose 6.1%, and the CPI less food and energy rose 5.5%. Core PCE is for March and increased 4.6% year-over-year.
Note: The Cleveland Fed released the median CPI details. "Used Cars" increased at a 69% annualized rate in April (this will reverse in May), and "Car and truck rental" decreased at a 33% annualized rate.
Note that Owners' Equivalent Rent and Rent of Primary Residence account for 1/3 of median CPI, and these measures were up almost 7% annualized. This data is lagged and asking rents have softened in recent months (due to the sharp slowdown in household formation).
YoY Measures of Inflation: Services, Goods and Shelter
by Calculated Risk on 5/10/2023 08:51:00 AM
Here a few measures of inflation:
The first graph is the one Fed Chair Powell has been mentioning.
 Click on graph for larger image.
This graph shows the YoY price change for Services and Services less rent of shelter through March 2023.
Services were up 6.8% YoY as of April 2023, down from 7.2% YoY in March.
Services less rent of shelter was up 5.2% YoY in April, down from 6.1% YoY in March.
Services less rent of shelter was up 5.2% YoY in April, down from 6.1% YoY in March.
Will services ex-shelter inflation be persistent, or will it follow a similar pattern as goods? This is a topic I discussed in Pandemic Economics, Housing and Monetary Policy: Part 2.
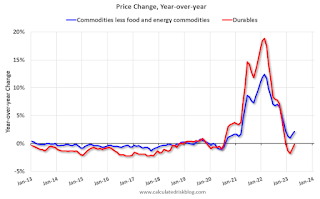 The second graph shows that goods prices started to increase year-over-year (YoY) in 2020 and accelerated in 2021 due to both strong demand and supply chain disruptions.
 The second graph shows that goods prices started to increase year-over-year (YoY) in 2020 and accelerated in 2021 due to both strong demand and supply chain disruptions.
Durables were at -0.2% YoY as of April 2023, up from -1.0% YoY in March.
Commodities less food and energy commodities were up 2.1% YoY in April, up from 1.6% YoY in March.
Commodities less food and energy commodities were up 2.1% YoY in April, up from 1.6% YoY in March.
Goods inflation was transitory.
 Here is a graph of the year-over-year change in shelter from the CPI report (through April) and housing from the PCE report (through March 2023)
Shelter was up 8.1% year-over-year in March, down from 8.2% in March. Housing (PCE) was up 8.3% YoY in March.
The BLS noted this morning: "The index for shelter was the largest contributor to the monthly all items increase ..."
BLS: CPI increased 0.4% in April; Core CPI increased 0.4%
by Calculated Risk on 5/10/2023 08:32:00 AM
The Consumer Price Index for All Urban Consumers (CPI-U) rose 0.4 percent in April on a seasonally adjusted basis, after increasing 0.1 percent in March, the U.S. Bureau of Labor Statistics reported today. Over the last 12 months, the all items index increased 4.9 percent before seasonal adjustment.CPI was slightly lower than expected and core CPI slightly higher than expectations. I'll post a graph later today after the Cleveland Fed releases the median and trimmed-mean CPI.
The index for shelter was the largest contributor to the monthly all items increase, followed by increases in the index for used cars and trucks and the index for gasoline. The increase in the gasoline index more than offset declines in other energy component indexes, and the energy index rose 0.6 percent in April. The food index was unchanged in April, as it was in March. The index for food at home fell 0.2 percent over the month while the index for food away from home rose 0.4 percent.
The index for all items less food and energy rose 0.4 percent in April, as it did in March. Indexes which increased in April include shelter, used cars and trucks, motor vehicle insurance, recreation, household furnishings and operations, and personal care. The index for airline fares and the index for new vehicles were among those that decreased over the month.
The all items index increased 4.9 percent for the 12 months ending April; this was the smallest 12-month increase since the period ending April 2021. The all items less food and energy index rose 5.5 percent over the last 12 months. The energy index decreased 5.1 percent for the 12 months ending April, and the food index increased 7.7 percent over the last year.
emphasis added
MBA: Mortgage Applications Increased in Weekly Survey
by Calculated Risk on 5/10/2023 07:00:00 AM
From the MBA: Mortgage Applications Increase in Latest MBA Weekly Survey
Mortgage applications increased 6.3 percent from one week earlier, according to data from the Mortgage Bankers Association’s (MBA) Weekly Mortgage Applications Survey for the week ending May 5, 2023.
The Market Composite Index, a measure of mortgage loan application volume, increased 6.3 percent on a seasonally adjusted basis from one week earlier. On an unadjusted basis, the Index increased 7 percent compared with the previous week. The Refinance Index increased 10 percent from the previous week and was 44 percent lower than the same week one year ago. The seasonally adjusted Purchase Index increased 5 percent from one week earlier. The unadjusted Purchase Index increased 5.3 percent compared with the previous week and was 32 percent lower than the same week one year ago.
“Mortgage applications responded positively to a drop in rates last week, as the Fed signaled a potential pause at the current level for the federal funds rate in anticipation of inflation slowing and tightening financial conditions that will slow economic and job growth. Mortgage rates for all surveyed loan types decreased over the week with the 30-year fixed rate at 6.48 percent,” said Joel Kan, MBA’s Vice President and Deputy Chief Economist. “Purchase applications increased 5 percent last week but were still more than 30 percent below last year’s level. Lower rates from week to week have helped buyers in the market, but limited for-sale inventory remains a challenge for many homebuyers. Refinance activity jumped 10 percent to its highest levels since September 2022, although there is only a small pool of borrowers who can benefit from refinancing with rates at these levels.”
...
The average contract interest rate for 30-year fixed-rate mortgages with conforming loan balances ($726,200 or less) decreased to 6.48 percent from 6.50 percent, with points decreasing to 0.61 from 0.63 (including the origination fee) for 80 percent loan-to-value ratio (LTV) loans.
emphasis added
 Click on graph for larger image.
The first graph shows the MBA mortgage purchase index.
According to the MBA, purchase activity is down 32% year-over-year unadjusted.
Red is a four-week average (blue is weekly).

The second graph shows the refinance index since 1990.
With higher mortgage rates, the refinance index declined sharply in 2022 - and has mostly flat lined at a low level since then.
Tuesday, May 09, 2023
Wednesday: CPI
by Calculated Risk on 5/09/2023 08:55:00 PM
 Note: Mortgage rates are from MortgageNewsDaily.com and are for top tier scenarios.
Wednesday:
• At 7:00 AM ET, The Mortgage Bankers Association (MBA) will release the results for the mortgage purchase applications index.
• At 8:30 AM, The Consumer Price Index for April from the BLS. The consensus is for 0.4% increase in CPI (up 5.0% YoY), and a 0.3% increase in core CPI (up 5.5% YoY).
Leading Index for Commercial Real Estate Decreased in April
by Calculated Risk on 5/09/2023 04:17:00 PM
From Dodge Data Analytics: Dodge Momentum Index Declines In April After Pullback In Commercial Planning
The Dodge Momentum Index (DMI), issued by Dodge Construction Network, fell 5.1% in April to 180.9 (2000=100) from the revised March reading of 190.6. In April, the commercial component of the DMI fell 8.0%, and the institutional component improved 0.3%.
“On par with our expectations, the Dodge Momentum Index continued to recede in April, due to declining economic conditions and ongoing banking uncertainty.” stated Sarah Martin, associate director of forecasting for Dodge Construction Network. “Weaker commercial planning is driving the DMI’s decline, as it is more exposed to real-time economic changes than the largely publicly funded institutional segment.”
Commercial planning in April was pushed down by sluggish office, hotel and retail activity. Institutional planning remained flat, as weak education planning offset growth in healthcare and amusement projects. Year over year, the DMI remains 11% higher than in April 2022. The commercial and institutional components were up 7% and 17% respectively.
...
The DMI is a monthly measure of the initial report for nonresidential building projects in planning, shown to lead construction spending for nonresidential buildings by a full year.
emphasis added
 Click on graph for larger image.
This graph shows the Dodge Momentum Index since 2002. The index was at 180.9 in April, down from 190.6 the previous month.
According to Dodge, this index leads "construction spending for nonresidential buildings by a full year". This index suggests a solid pickup in commercial real estate construction in early 2023. but a slowdown towards the end of 2023 or in 2024.
Commercial construction is a lagging economic indicator.
House Price Battle Royale: Low Inventory vs Affordability
by Calculated Risk on 5/09/2023 10:33:00 AM
Today, in the Calculated Risk Real Estate Newsletter: House Price Battle Royale: Low Inventory vs Affordability
Brief excerpt:
I’ve been wrestling with the impact on house prices of the rapid increase in mortgage rates and monthly payments over the last year. My reaction was the current situation was somewhat similar to the 1978 to 1982 period and we would see prices decline in real terms (adjusted for inflation). See from March 2022: Housing: Don't Compare the Current Housing Boom to the Bubble and Bust.There is much more in the post. You can subscribe at https://calculatedrisk.substack.com/.
In that article I wrote on prices:[W]e should expect something similar to the what happened in the late ‘70s - a decline in real house prices seems likely … Currently we just have to watch and wait. However, we can be fairly confident that we won’t see cascading nominal price declines like during the housing bust - since there will be few distressed sales.In the 1980 period, nominal prices only declined slightly on a month-to-month basis a few times according to the Case-Shiller National house price index. However, real prices - adjusted for inflation - declined 10.7% from the peak. The inflation adjusted peak was in October 1979, and real prices didn’t exceed that peak until May 1986 (See from October 2022: House Prices: 7 Years in Purgatory).
Note that if we use the Freddie Mac House Price Index, nominal prices declined 6.9% in the early 1980s, and real prices declined 17.5%!
As I noted in “7 Years in Purgatory”:Earlier this year, I argued the most likely path for house prices was for nominal prices to “stall”, and for real prices (inflation adjusted) to decline over several years. The arguments for a stall included historically low inventory levels, mostly solid lending over the last decade, and that house prices tend to be sticky downwards. … However, we are already seeing nominal house price declines on a national basis.And the historically low level of inventory is a key reason house prices haven’t declined more to date. As of February, the Case-Shiller National Index was off 2.8% in nominal terms (seasonally adjusted), and off 4.6% in real terms.
Here is a look at the house price battle between low inventory and affordability.
Second Home Market: South Lake Tahoe in April
by Calculated Risk on 5/09/2023 08:27:00 AM
With the pandemic, there was a surge in 2nd home buying.
I'm looking at data for some second home markets - and I'm tracking those markets to see if there is an impact from lending changes, rising mortgage rates or the easing of the pandemic.
This graph is for South Lake Tahoe since 2004 through April 2023, and shows inventory (blue), and the year-over-year (YoY) change in the median price (12-month average).
Note: The median price is a 12-month average, and is distorted by the mix, but this is the available data.
 Click on graph for larger image.
Following the housing bubble, prices declined for several years in South Lake Tahoe, with the median price falling about 50% from the bubble peak.
Currently inventory is still very low, and only up slightly from the record low set in February 2022.
Prices are down 3.4% YoY, even with inventory at historically low levels.
It is possible the massive snowstorms have limited listings in the Tahoe market this year.
It is possible the massive snowstorms have limited listings in the Tahoe market this year.
Monday, May 08, 2023
"Mortgage Rates Jump to Highest Levels Since Last Monday"
by Calculated Risk on 5/08/2023 09:00:00 PM
 From Matthew Graham at Mortgage News Daily: Mortgage Rates Jump to Highest Levels Since Last Monday
Mortgage rates moved noticeably higher to start the new week--high enough that you'd have to go back to last Monday to see anything higher. That's the bad news.Tuesday:
The good news is that rates are in the midst of their flattest trend in a long time. This is true both in a broad sense going back to Q4 2022 and a more recent/narrow sense going back to mid-March. Since then, the top tier 30yr fixed rate hasn't strayed too far from 6.5% despite spending time on both sides of that level. [30 year fixed 6.65%]
emphasis added
• At 6:00 AM ET, NFIB Small Business Optimism Index for April.
Update: Framing Lumber Prices Down 57% YoY, Below Pre-Pandemic Levels
by Calculated Risk on 5/08/2023 04:00:00 PM
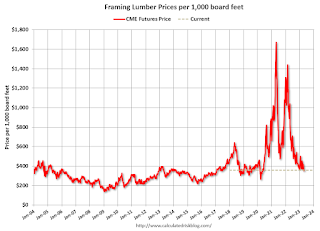
Here is another monthly update on framing lumber prices.
This graph shows CME random length framing futures through May 8th.
Lumber is currently at $356 per 1000 board feet.
This is down from the peak of $1,733, and down 57% from $827 a year ago.
Prices are below the pre-pandemic levels of around $400.
 Click on graph for larger image.
We didn't see a significant runup in prices this Spring due to the housing slowdown.
Prices are below the pre-pandemic levels of around $400.
 Click on graph for larger image.
There is somewhat of a seasonal demand for lumber, and lumber prices usually peak in April or May.
We didn't see a significant runup in prices this Spring due to the housing slowdown.


