by Calculated Risk on 5/16/2023 08:40:00 AM
Tuesday, May 16, 2023
Retail Sales Increased 0.4% in April
On a monthly basis, retail sales were up 0.4% from March to April (seasonally adjusted), and sales were up 1.6 percent from April 2022.
From the Census Bureau report:
Advance estimates of U.S. retail and food services sales for April 2023, adjusted for seasonal variation and holiday and trading-day differences, but not for price changes, were $686.1 billion, up 0.4 percent from the previous month, and up 1.6 percent above April 2022. ... The February 2023 to March 2023 percent change was revised from down 0.6 percent to down 0.7 percent.
emphasis added
 Click on graph for larger image.
This graph shows retail sales since 1992. This is monthly retail sales and food service, seasonally adjusted (total and ex-gasoline).
Retail sales ex-gasoline were up 0.5% in April.
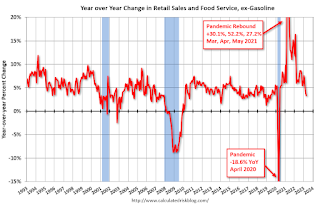
The second graph shows the year-over-year change in retail sales and food service (ex-gasoline) since 1993.
Retail and Food service sales, ex-gasoline, increased by 3.3% on a YoY basis.
 Sales in April were below expectations, and sales in March were revised down.
Monday, May 15, 2023
Tuesday: Retail Sales, Industrial Production, Homebuilder Survey
by Calculated Risk on 5/15/2023 08:46:00 PM

While it may be blessing for rates to be flatter and more predictable lately, the fact that the sideways range is close to long-term highs feels more like a curse. ... Apart from the year-end drift in December and the false start created by strong econ data in February, bonds have spent almost all of their time in the same range for 6 months now. [30 year fixed 6.67%]Tuesday:
emphasis added
• At 8:30 AM ET, Retail sales for April is scheduled to be released. The consensus is for 0.6% increase in retail sales.
• At 9:15 AM, The Fed will release Industrial Production and Capacity Utilization for April. The consensus is for a 0.1% decrease in Industrial Production, and for Capacity Utilization to decrease to 79.7%.
• At 10:00 AM, The May NAHB homebuilder survey. The consensus is for a reading of 45 unchanged from 45 last month. Any number below 50 indicates that more builders view sales conditions as poor than good.
MBA Survey: "Share of Mortgage Loans in Forbearance Decreases to 0.51% in April"
by Calculated Risk on 5/15/2023 04:00:00 PM
From the MBA: Share of Mortgage Loans in Forbearance Decreases to 0.51% in April
The Mortgage Bankers Association’s (MBA) monthly Loan Monitoring Survey revealed that the total number of loans now in forbearance decreased by 4 basis points from 0.55% of servicers’ portfolio volume in the prior month to 0.51% as of April 30, 2023. According to MBA’s estimate, 255,000 homeowners are in forbearance plans. Mortgage servicers have provided forbearance to approximately 7.8 million borrowers since April 2020.
In April 2023, the share of Fannie Mae and Freddie Mac loans in forbearance decreased 2 basis points to 0.24%. Ginnie Mae loans in forbearance decreased 7 basis points to 1.11%, and the forbearance share for portfolio loans and private-label securities (PLS) decreased 7 basis points to 0.61%.
“While the number of loans in forbearance continues to dwindle, there was some deterioration in the performance of post-forbearance workouts,” said Marina Walsh, CMB, MBA’s Vice President of Industry Analysis. “About three out of four borrowers are remaining current on their post-forbearance workouts, but this is down from the average of four out of five borrowers that was relatively consistent in 2022 and into 2023.”
Added Walsh, “Overall servicing portfolios remain healthy, and some of the worsening monthly performance can be attributed to seasonal factors such as tax refunds that pushed up the March results and then normalized in April. MBA’s forecast calls for an economic slowdown and an increase in unemployment later this year and into 2024, which will impact loan performance.
emphasis added
 Click on graph for larger image.
This graph shows the percent of portfolio in forbearance by investor type over time.
The share of forbearance plans has been decreasing, declined to 0.51% in April from 0.55% in March.
At the end of April, there were about 255,000 homeowners in forbearance plans.
3rd Look at Local Housing Markets in April
by Calculated Risk on 5/15/2023 12:33:00 PM
Today, in the Calculated Risk Real Estate Newsletter: 3rd Look at Local Housing Markets in April
A brief excerpt:
This is the third look at local markets in April. I’m tracking about 40 local housing markets in the US. Some of the 40 markets are states, and some are metropolitan areas. I update these tables throughout the month as data is released.There is much more in the article. You can subscribe at https://calculatedrisk.substack.com/
Closed sales in April were mostly for contracts signed in February and March. Since 30-year fixed mortgage rates were over 6% for all of February and March - compared to the 4% range the previous year - closed sales were down significantly year-over-year in April.
It is likely sales were down more year-over-year in April than in March, however, the impact was probably not as severe as for closed sales in December and January (rates were the highest in October and November 2022 when contracts were signed for closing in December and January).
...
In April, sales in these markets were down 24.7%. In March, these same markets were down 19.8% YoY Not Seasonally Adjusted (NSA).
This is a larger YoY decline NSA than in March for these markets, however there was one less selling day in April this year. This data suggests the April existing home sales report will show another significant YoY decline, and the 20th consecutive month with a YoY decline in sales.
More local markets to come!
NY Fed Q1 Report: Household Debt Increases, Mortgage Loan Growth Slows
by Calculated Risk on 5/15/2023 11:12:00 AM
From the NY Fed: Total Household Debt Reaches $17.05 trillion in Q1 2023; Mortgage Loan Growth Slows
The Federal Reserve Bank of New York's Center for Microeconomic Data today issued its Quarterly Report on Household Debt and Credit. The Report shows an increase in total household debt in the first quarter of 2023, increasing by $148 billion (0.9%) to $17.05 trillion. Balances now stand $2.9 trillion higher than at the end of 2019, before the pandemic recession. The report is based on data from the New York Fed's nationally representative Consumer Credit Panel.
Mortgage balances rose modestly by $121 billion in the first quarter of 2023 and stood at $12.04 trillion at the end of March. Credit card balances were flat in the first quarter, at $986 billion. Auto loan balances increased by $10 billion in the first quarter, bucking the typical trend of balance declines in first quarters. Student loan balances slightly increased and now stand at $1.60 trillion. Other balances, which include retail cards and other consumer loans, increased by $5 billion. In total, non-housing balances grew by $24 billion.
Mortgage originations, which include refinances, dropped sharply in the first quarter of 2023 to $324 billion, the lowest level seen since 2014. The volume of newly originated auto loans was $162 billion, a reduction from pandemic-era highs but still elevated compared to pre-Covid volumes. Aggregate limits on credit card accounts increased by $119 billion, representing a 2.7% increase from Q4 2022 levels. Limits on home equity lines of credit were up by $9 billion in the first quarter.
The share of current debt becoming delinquent increased for most debt types. The delinquency transition rate for credit cards and auto loans increased by 0.6 and 0.2 percentage points, respectively approaching or surpassing their pre-pandemic levels.
emphasis added
 Click on graph for larger image.
Here are three graphs from the report:
The first graph shows aggregate consumer debt increased in Q1. Household debt previously peaked in 2008 and bottomed in Q3 2013. Unlike following the great recession, there wasn't a decline in debt during the pandemic.
From the NY Fed:
Aggregate household debt balances increased by $148 billion in the first quarter of 2023, a 0.9% rise from 2022Q4. Balances now stand at $17.05 trillion and have increased by $2.9 trillion since the end of 2019, just before the pandemic recession.
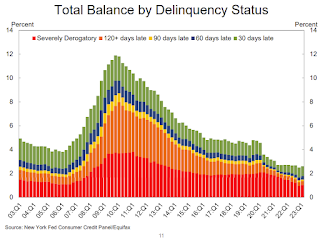 The second graph shows the percent of debt in delinquency.
The overall delinquency rate increased slightly in Q1. From the NY Fed:
Aggregate delinquency rates were roughly flat in the first quarter of 2023 and remained low, after declining sharply through the beginning of the pandemic. As of March, 2.6% of outstanding debt was in some stage of delinquency, 2.1 percentage points lower than last quarter of 2019, just before the COVID-19 pandemic hit the United States.
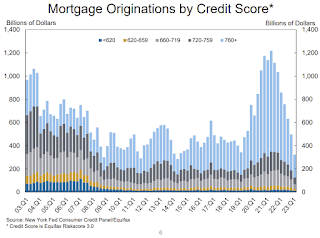 The third graph shows Mortgage Originations by Credit Score.
From the NY Fed:
Mortgage originations measured as appearances of new mortgages on consumer credit reports, dropped sharply in the first quarter of 2023 to $324 billion, the lowest seen since 2014Q2, a quarter that was unusually low due to the “taper tantrum”. ... Limits on home equity lines of credit (HELOC) were up by $9 billion, or a 1% increase. ... The median credit score for newly originated mortgages decreased slightly to 765.There is much more in the report.
Housing May 15th Weekly Update: Inventory Increased 0.2% Week-over-week
by Calculated Risk on 5/15/2023 08:21:00 AM
 Click on graph for larger image.
This inventory graph is courtesy of Altos Research.

Sunday, May 14, 2023
Monday: NY Fed Mfg, Q1 Quarterly Report on Household Debt and Credit
by Calculated Risk on 5/14/2023 06:17:00 PM
Weekend:
• Schedule for Week of May 14, 2023
Monday:
• At 8:30 AM ET, The New York Fed Empire State manufacturing survey for May. The consensus is for a reading of -2.0, down from 10.8.
• At 11:00 AM, NY Fed: Q1 Quarterly Report on Household Debt and Credit
From CNBC: Pre-Market Data and Bloomberg futures S&P 500 are down 7 and DOW futures are down 50 (fair value).
Oil prices were down over the last week with WTI futures at $70.04 per barrel and Brent at $74.17 per barrel. A year ago, WTI was at $111, and Brent was at $112 - so WTI oil prices are down about 35% year-over-year.
Here is a graph from Gasbuddy.com for nationwide gasoline prices. Nationally prices are at $3.53 per gallon. A year ago, prices were at $4.44 per gallon, so gasoline prices are down $0.91 per gallon year-over-year.
DOT: Vehicle Miles Driven Increased 0.6% year-over-year in March
by Calculated Risk on 5/14/2023 11:27:00 AM
This is something I check occasionally.
The Department of Transportation (DOT) reported:
Travel on all roads and streets changed by +0.6% (+1.7 billion vehicle miles) for March 2023 as compared with March 2022. Travel for the month is estimated to be 271.2 billion vehicle miles.
The seasonally adjusted vehicle miles traveled for March 2023 is 266.8 billion miles, a 0.3% ( 0.9 billion vehicle miles) change over March 2022. It also represents a -1.1% change (-3.0 billion vehicle miles) compared with February 2023.
emphasis added
 Click on graph for larger image.
This graph shows the monthly total vehicle miles driven, seasonally adjusted.
Miles driven declined sharply in March 2020, and really collapsed in April 2020. Miles driven are now slightly below pre-pandemic levels.
Saturday, May 13, 2023
Real Estate Newsletter Articles this Week: "House Price Battle Royale: Low Inventory vs Affordability"
by Calculated Risk on 5/13/2023 02:11:00 PM
At the Calculated Risk Real Estate Newsletter this week:
• Part 1: Current State of the Housing Market; Overview for mid-April
• Part 2: Current State of the Housing Market; Overview for mid-April
• House Price Battle Royale: Low Inventory vs Affordability
• Lawler: American Homes 4 Rent Net Seller of Single-Family Homes Last Quarter
• 2nd Look at Local Housing Markets in April
This is usually published 4 to 6 times a week and provides more in-depth analysis of the housing market.
You can subscribe at https://calculatedrisk.substack.com/
Most content is available for free (and no Ads), but please subscribe!
Schedule for Week of May 14, 2023
by Calculated Risk on 5/13/2023 08:11:00 AM
The key reports this week are April Retail Sales, Housing Starts and Existing Home Sales.
For manufacturing, April Industrial Production, and the May NY and Philly Fed manufacturing surveys will be released.
Fed Chair Powell speaks on Friday.
8:30 AM: The New York Fed Empire State manufacturing survey for May. The consensus is for a reading of -2.0, down from 10.8.
11:00 AM: NY Fed: Q1 Quarterly Report on Household Debt and Credit
 8:30 AM ET: Retail sales for April is scheduled to be released. The consensus is for 0.6% increase in retail sales.
This graph shows retail sales since 1992. This is monthly retail sales and food service, seasonally adjusted (total and ex-gasoline).
Retail sales were down 0.6% in March (revised).
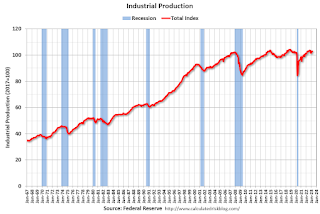 9:15 AM: The Fed will release Industrial Production and Capacity Utilization for April.
This graph shows industrial production since 1967.
The consensus is for a 0.1% decrease in Industrial Production, and for Capacity Utilization to decrease to 79.7%.
10:00 AM: The May NAHB homebuilder survey. The consensus is for a reading of 45 unchanged from 45 last month. Any number below 50 indicates that more builders view sales conditions as poor than good.
7:00 AM ET: The Mortgage Bankers Association (MBA) will release the results for the mortgage purchase applications index.
 8:30 AM ET: Housing Starts for April.
 This graph shows single and total housing starts since 2000.
The consensus is for 1.396 million SAAR, down from 1.420 million SAAR in March.
8:30 AM: The initial weekly unemployment claims report will be released. The consensus is for 253 thousand initial claims, down from 264 thousand last week.
8:30 AM: the Philly Fed manufacturing survey for May. The consensus is for a reading of -21.1, up from -31.3.
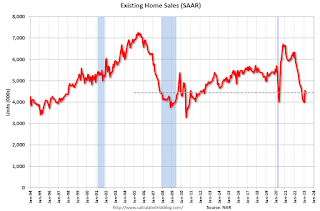 10:00 AM: Existing Home Sales for April from the National Association of Realtors (NAR). The consensus is for 4.30 million SAAR, down from 4.44 million.
The graph shows existing home sales from 1994 through the report last month.
10:00 AM: State Employment and Unemployment (Monthly) for April 2023
11:00 AM: Discussion, Conversation with Chair Jerome Powell and Ben Bernanke, former Chair of the Board of Governors of the Federal Reserve System At the Thomas Laubach Research Conference, Washington, D.C.


