 RSS Feed
 by Calculated Risk on 5/26/2023 08:58:00 AM
Friday, May 26, 2023
PCE Measure of Shelter Still Accelerating YoY
Here is a graph of the year-over-year change in shelter from the CPI report and housing from the PCE report this morning, both through April 2023.
 CPI Shelter was up 8.1% year-over-year in April, down from 8.2% in March.
Housing (PCE) was up 8.4% YoY in April, up from 8.3% in March.
Since asking rents are soft and Year-over-year Rent Growth Continues to Decelerate this means both CPI and PCE measures are currently overstating actual inflation.
Since asking rents are soft and Year-over-year Rent Growth Continues to Decelerate this means both CPI and PCE measures are currently overstating actual inflation.
Personal Income increased 0.4% in April; Spending increased 0.8%
by Calculated Risk on 5/26/2023 08:40:00 AM
The BEA released the Personal Income and Outlays report for April:
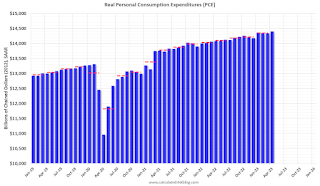
Personal income increased $80.1 billion (0.4 percent at a monthly rate) in April, according to estimates released today by the Bureau of Economic Analysis. Disposable personal income (DPI) increased $79.4 billion (0.4 percent) and personal consumption expenditures (PCE) increased $151.7 billion (0.8 percent).The April PCE price index increased 4.4 percent year-over-year (YoY), up from 4.2 percent YoY in March, and down from the recent peak of 7.0 percent in June 2022.
The PCE price index increased 0.4 percent. Excluding food and energy, the PCE price index increased 0.4 percent. Real DPI increased less than 0.1 percent in April and Real PCE increased 0.5 percent; goods increased 0.8 percent and services increased 0.3 percent.
emphasis added
The PCE price index, excluding food and energy, increased 4.7 percent YoY, up from 4.6 percent in March, and down from the recent peak of 5.4 percent in February 2022.
The following graph shows real Personal Consumption Expenditures (PCE) through April 2023 (2012 dollars). Note that the y-axis doesn't start at zero to better show the change.
 Click on graph for larger image.
The dashed red lines are the quarterly levels for real PCE.
Personal income was at expectations, and PCE was above expectations.
Inflation was above expectations.
Thursday, May 25, 2023
Friday: Personal Income and Outlays, Durable Goods
by Calculated Risk on 5/25/2023 08:39:00 PM
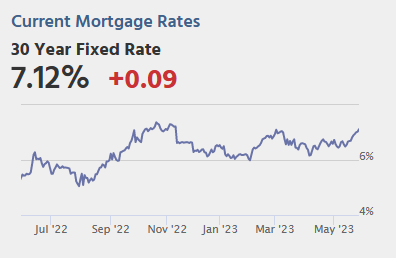 Note: Mortgage rates are from MortgageNewsDaily.com and are for top tier scenarios.
Friday:
• At 8:30 AM ET, Personal Income and Outlays, April 2023. The consensus is for a 0.4% increase in personal income, and for a 0.4% increase in personal spending. And for the Core PCE price index to increase 0.3%. PCE prices are expected to be up 4.3% YoY, and core PCE prices up 4.6% YoY.
• Also at 8:30 AM, Durable Goods Orders for April from the Census Bureau. The consensus is for a 1.1% decrease in durable goods orders.
• At 10:00 AM, University of Michigan's Consumer sentiment index (Final for May). The consensus is for a reading of 57.7.
Realtor.com Reports Weekly Active Inventory Up 20% YoY; New Listings Down 26% YoY
by Calculated Risk on 5/25/2023 04:05:00 PM
Realtor.com has monthly and weekly data on the existing home market. Here is their weekly report from chief economist Danielle Hale: Weekly Housing Trends View — Data Week Ending May 20, 2023
• Active inventory growth slowed again, with for-sale homes up just 20% above one year ago. The number of homes for sale was higher than this time last year, but not by as much as we’ve seen in recent weeks. As we have discussed, further slowing is likely ahead. One key way that this has played out is by pushing some home shoppers to consider buying a newly built home.
...
• New listings–a measure of sellers putting homes up for sale–were down again this week, by 26% from one year ago. The number of newly listed homes has been lower than the same time the previous year for the past 46 weeks. This week tied last week’s drop. With roughly two thirds of existing homeowners holding onto a mortgage more than 2 percentage points below current mortgage rates, it’s easy to see why new listings lag behind.
 Here is a graph of the year-over-year change in inventory according to realtor.com.
 Inventory is still up year-over-year - from record lows - however, the YoY increase has slowed sharply recently.
This was the smallest YoY increase since June 2022.
The recent trend suggests active inventory could be down YoY in June!
May Vehicle Sales Forecast: 15.3 million SAAR, Up Sharply YoY
by Calculated Risk on 5/25/2023 02:02:00 PM
From WardsAuto: May U.S. Light-Vehicle Sales Set for Biggest Volume Gain in 2023 (pay content). Brief excerpt:
Rising inventory, combined with pent-up demand, is keeping growth going mostly by holding the long list of economic- and price-related headwinds at bay, but there is potential for demand to sharply drop at the end of the month – and in June - if an agreement on the U.S. debt ceiling remains elusive and further spooks consumers.Note: When writing "biggest volume gain", Wards is referring to the year-over-year gain since sales were especially weak in May 2022.
emphasis added
 Click on graph for larger image.
This graph shows actual sales from the BEA (Blue), and Wards forecast for May (Red).
The Wards forecast of 15.3 million SAAR, would be down 3.9% from last month, and up 21.6% from a year ago.
Vehicle sales are usually a transmission mechanism for Federal Open Market Committee (FOMC) policy, although far behind housing. This time vehicle sales were more suppressed by supply chain issues and have picked up recently.
Total Housing Completions will Likely Decrease Slightly in 2023; The Mix will Change
by Calculated Risk on 5/25/2023 10:51:00 AM
Today, in the Calculated Risk Real Estate Newsletter: Total Housing Completions will Likely Decrease Slightly in 2023; The Mix will Change
Brief excerpt:
Although housing starts have slowed, completions will likely only decrease slightly in 2023.You can subscribe at https://calculatedrisk.substack.com/.
This graph shows total housing completions and placements since 1968 with an estimate for 2023. Note that the net additional to the housing stock is less because of demolitions and destruction of older housing units.
My current estimate is total completions (single-family, multi-family, manufactured homes) will decrease in 2023 to around 1.45 million, down from 1.505 million in 2022. However, the mix will change significantly from 2022 with fewer single family completions, and more multi-family completions.

NAR: Pending Home Sales Unchanged in April; Down 20.3% Year-over-year
by Calculated Risk on 5/25/2023 10:03:00 AM
From the NAR: Pending Home Sales Recorded No Change in April
Pending home sales recorded no change in April, according to the National Association of REALTORS®. Three U.S. regions posted monthly gains, while the Northeast decreased. All four regions saw year-over-year declines in transactions.This is way below expectations of a 0.5% increase for this index. Note: Contract signings usually lead sales by about 45 to 60 days, so this would usually be for closed sales in May and June.
The Pending Home Sales Index (PHSI)* – a forward-looking indicator of home sales based on contract signings – remained at 78.9 in April, posting no change from the previous month. Year over year, pending transactions dropped by 20.3%. An index of 100 is equal to the level of contract activity in 2001.
"Not all buying interests are being completed due to limited inventory," said NAR Chief Economist Lawrence Yun. "Affordability challenges certainly remain and continue to hold back contract signings, but a sizeable increase in housing inventory will be critical to get more Americans moving."
...
The Northeast PHSI dropped 11.3% from last month to 59.1, a decrease of 21.8% from April 2022. The Midwest index improved 3.6% to 78.4 in April, down 21.4% from one year ago.
The South PHSI increased 0.1% to 99.6 in April, sinking 16.7% from the prior year. The West index augmented 4.7% in April to 62.2, sliding 26.0% from April 2022.
emphasis added
Q1 GDP Growth Revised up to 1.3% Annual Rate
by Calculated Risk on 5/25/2023 08:40:00 AM
From the BEA: Gross Domestic Product (Second Estimate), Corporate Profits (Preliminary Estimate), First Quarter 2023
Real gross domestic product (GDP) increased at an annual rate of 1.3 percent in the first quarter of 2023, according to the "second" estimate released by the Bureau of Economic Analysis. In the fourth quarter, real GDP increased 2.6 percent.Here is a Comparison of Second and Advance Estimates. PCE growth was revised up from 3.7% to 3.8%. Residential investment was revised down from -4.2% to -5.4%.
The GDP estimate released today is based on more complete source data than were available for the "advance" estimate issued last month. In the advance estimate, the increase in real GDP was 1.1 percent (refer to "Updates to GDP"). The updated estimates primarily reflected an upward revision to private inventory investment.
The increase in real GDP reflected increases in consumer spending, exports, federal government spending, state and local government spending, and nonresidential fixed investment that were partly offset by decreases in private inventory investment and residential fixed investment. Imports, which are a subtraction in the calculation of GDP, increased.
emphasis added
Weekly Initial Unemployment Claims at 229,000
by Calculated Risk on 5/25/2023 08:35:00 AM
The DOL reported:
In the week ending May 20, the advance figure for seasonally adjusted initial claims was 229,000, an increase of 4,000 from the previous week's revised level. The previous week's level was revised down by 17,000 from 242,000 to 225,000. The 4-week moving average was 231,750, unchanged from the previous week's revised average. The previous week's average was revised down by 12,500 from 244,250 to 231,750.The following graph shows the 4-week moving average of weekly claims since 1971.
emphasis added
 Click on graph for larger image.
The dashed line on the graph is the current 4-week average. The four-week average of weekly unemployment claims was unchanged at 231,750.
The previous week was revised down.
Weekly claims were below the consensus forecast.
Wednesday, May 24, 2023
Thursday: 2nd Estimate Q1 GDP, Unemployment Claims, Pending Home Sales
by Calculated Risk on 5/24/2023 09:01:00 PM
 Note: Mortgage rates are from MortgageNewsDaily.com and are for top tier scenarios.
Thursday:
• At 8:30 AM ET, The initial weekly unemployment claims report will be released. The consensus is for 250 thousand initial claims, up from 242 thousand last week.
• Also at 8:30 AM, Gross Domestic Product, 1st quarter 2023 (Second estimate). The consensus is that real GDP increased 1.1% annualized in Q1, unchanged from the advance estimate of 1.1%.
• Also at 8:30 AM, Chicago Fed National Activity Index for April. This is a composite index of other data.
• At 10:00 AM, Pending Home Sales Index for April. The consensus is for a 0.5% increase in the index.
• At 11:00 AM, the Kansas City Fed manufacturing survey for May.


