by Calculated Risk on 5/30/2023 08:47:00 PM
Tuesday, May 30, 2023
Wednesday: Job Openings, Chicago PMI, Fed's Beige Book

The past 2 weeks were fairly rough for fans of low mortgage rates. The average lender moved higher at the fastest pace since February over that time. By the end of last week, the average lender was back above 7% for a top tier 30yr fixed scenario (and "well above" on Friday).Wednesday:
What a difference a weekend makes. While we're nowhere near the lower levels seen several weeks ago, the bond market (which underlies rates) was able to recover all of the losses seen on Thursday and Friday as well as a small portion of Wednesday's to boot. [30 year fixed 6.96%]
emphasis added
• At 7:00 AM ET, The Mortgage Bankers Association (MBA) will release the results for the mortgage purchase applications index.
• At 9:45 AM, Chicago Purchasing Managers Index for May.
• At 10:00 AM, Job Openings and Labor Turnover Survey for April from the BLS.
• At 2:00 PM, the Federal Reserve Beige Book, an informal review by the Federal Reserve Banks of current economic conditions in their Districts.
A few comments on the Seasonal Pattern for House Prices
by Calculated Risk on 5/30/2023 02:41:00 PM
Two key points:
1) There is a clear seasonal pattern for house prices.
2) The surge in distressed sales during the housing bust distorted the seasonal pattern.
For in depth description of these issues, see Jed Kolko's article from 2014 "Let’s Improve, Not Ignore, Seasonal Adjustment of Housing Data"
Note: I was one of several people to question the change in the seasonal factor (here is a post in 2009) - and this led to S&P Case-Shiller questioning the seasonal factor too (from April 2010). I still use the seasonal factor (I think it is better than using the NSA data).

This graph shows the month-to-month change in the NSA Case-Shiller National index since 1987 (through March 2023). The seasonal pattern was smaller back in the '90s and early '00s and increased once the bubble burst.
The seasonal swings declined following the bust, however the price surge changed the month-over-month pattern.
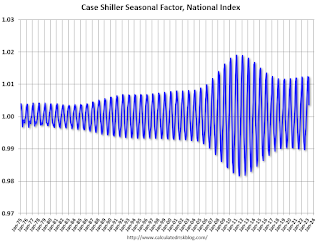
The swings in the seasonal factors have decreased, and the seasonal factors had been moving back towards more normal levels.
Comments on March Case-Shiller and FHFA House Prices
by Calculated Risk on 5/30/2023 10:30:00 AM
Today, in the Calculated Risk Real Estate Newsletter: Case-Shiller: National House Price Index Increased 0.7% year-over-year in March
Excerpt:
The recent increase in mortgage rates to over 7% will not impact the Case-Shiller index until reports released in the Fall.
...
Here is a comparison of year-over-year change in median house prices from the NAR and the year-over-year change in the Case-Shiller index. Median prices are distorted by the mix and repeat sales indexes like Case-Shiller and FHFA are probably better for measuring prices. However, in general, the Case-Shiller index follows the median price.
The median price was down 1.7% year-over-year in April, and the Case-Shiller National Index will likely be down year-over-year in the April report.
Note: I’ll have more on real prices, price-to-rent and affordability later this week.
Case-Shiller: National House Price Index increased 0.7% year-over-year in March
by Calculated Risk on 5/30/2023 09:30:00 AM
S&P/Case-Shiller released the monthly Home Price Indices for March ("March" is a 3-month average of January, February and March closing prices).
This release includes prices for 20 individual cities, two composite indices (for 10 cities and 20 cities) and the monthly National index.
From CNBC Home price declines may be over, S&P Case-Shiller says
Nationally, home prices in March were 0.7% higher than March 2022, the S&P CoreLogic Case-Shiller Indices said Tuesday.
“The modest increases in home prices we saw a month ago accelerated in March 2023,” said Craig J. Lazzara, managing director at S&P DJI in a release. “Two months of increasing prices do not a definitive recovery make, but March’s results suggest that the decline in home prices that began in June 2022 may have come to an end.”
The 10-city composite, which includes the Los Angeles and New York metropolitian areas, dropped 0.8% year over year, compared with a 0.5% increase in the previous month. The 20-city composite, which includes Dallas-Fort Worth and the Detroit area, fell 1.1%, down from a 0.4% annual gain in the previous month.
emphasis added
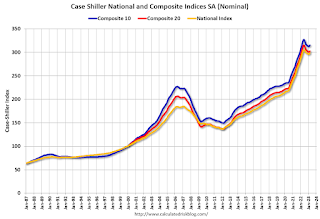 Click on graph for larger image.
 The first graph shows the nominal seasonally adjusted Composite 10, Composite 20 and National indices (the Composite 20 was started in January 2000).
The Composite 10 index is up 0.6% in March (SA) and down 3.6% from the recent peak in June 2022.
The Composite 20 index is up 0.5% (SA) in March and down 4.0% from the recent peak in June 2022.
The National index is up 0.4% (SA) in March and is down 2.2% from the peak in June 2022.
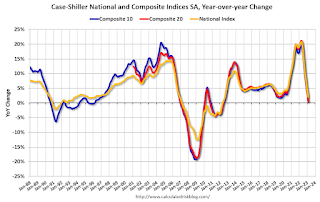
 The second graph shows the year-over-year change in all three indices.
The Composite 10 SA is down 0.8% year-over-year. The Composite 20 SA is down 1.1% year-over-year.
The National index SA is up 0.7% year-over-year.
Annual price increases were below expectations. I'll have more later.
Monday, May 29, 2023
Tuesday: Case-Shiller House Prices
by Calculated Risk on 5/29/2023 08:13:00 PM
 Hanging out with my 101 years young data at a Memorial Day Ceremony in San Diego.
Weekend:
• Schedule for Week of May 28, 2023
Monday:
• At 9:00 AM ET, S&P/Case-Shiller House Price Index for March.
• Also at 9:00 AM, FHFA House Price Index for March 2022. This was originally a GSE only repeat sales, however there is also an expanded index.
• At 10:00 AM, Dallas Fed Survey of Manufacturing Activity for May.
From CNBC: Pre-Market Data and Bloomberg futures S&P 500 are up 9 and DOW futures are up 42 (fair value).
 Oil prices were up over the last week with WTI futures at $72.51 per barrel and Brent at $76.57 per barrel. A year ago, WTI was at $115, and Brent was at $123 - so WTI oil prices are down about 37% year-over-year.
Here is a graph from Gasbuddy.com for nationwide gasoline prices. Nationally prices are at $3.54 per gallon. A year ago, prices were at $4.60 per gallon, so gasoline prices are down $1.06 per gallon year-over-year.
Recession Watch Update
by Calculated Risk on 5/29/2023 12:06:00 PM
Way back in 2013, I wrote a post "Predicting the Next Recession. In that 2013 post, I wrote:
The next recession will probably be caused by one of the following (from least likely to most likely):Unfortunately, in 2020, one of those low probability events happened (pandemic), and that led to a recession in 2020.
3) An exogenous event such as a pandemic, significant military conflict, disruption of energy supplies for any reason, a major natural disaster (meteor strike, super volcano, etc), and a number of other low probability reasons. All of these events are possible, but they are unpredictable, and the probabilities are low that they will happen in the next few years or even decades.
emphasis added
2) Significant policy error. Two examples: not reaching a fiscal agreement and going off the "fiscal cliff" probably would have led to a recession, and Congress refusing to "pay the bills" would have been a policy error that would have taken the economy into recession.That was written in 2013, and it appears once again that we've avoided the "default" policy error.
1) Most of the post-WWII recessions were caused by the Fed tightening monetary policy to slow inflation. I think this is the most likely cause of the next recession. Usually, when inflation starts to become a concern, the Fed tries to engineer a "soft landing", and frequently the result is a recession.And this most common cause of a recession is the current concern.
The economic forecast prepared by the staff for the May FOMC meeting continued to assume that the effects of the expected further tightening in bank credit conditions, amid already tight financial conditions, would lead to a mild recession starting later this year, followed by a moderately paced recovery. Real GDP was projected to decelerate over the next two quarters before declining modestly in both the fourth quarter of this year and the first quarter of next year.And the FOMC members have been essentially projecting a recession for some time (although they avoid using the word "recession"). Here are their March projections for GDP and unemployment.
emphasis added
| GDP projections of Federal Reserve Governors and Reserve Bank presidents, Change in Real GDP1 | ||||
|---|---|---|---|---|
| Projection Date | 2023 | 2024 | 2025 | |
| Mar 2023 | 0.0 to 0.8 | 1.0 to 1.5 | 1.7 to 2.1 | |
| Unemployment projections of Federal Reserve Governors and Reserve Bank presidents, Unemployment Rate2 | ||||
|---|---|---|---|---|
| Projection Date | 2023 | 2024 | 2025 | |
| Mar 2023 | 4.0 to 4.7 | 4.3 to 4.9 | 4.3 to 4.8 | |
Since the unemployment rate was at 3.4% in April and depending on the growth of the civilian labor force in 2023, the FOMC is projecting between 800 thousand and 2 million jobs lost over the last two quarters of 2023. That is a clear employment recession.
 One of the leading indicators for recessions is the yield curve. Here is a graph of 10-Year Treasury Constant Maturity Minus 2-Year Treasury Constant Maturity from FRED.
Click here for interactive graph at FRED.
My yield-curve indicator has gone Code Red. It is 8 for 8 in forecasting recessions since 1968 —with no false alarms. I have reasons to believe, however, that it is flashing a false signal.
...
The yield curve has now inverted for a ninth time since 1968. Does it spell doom? I am not so sure.
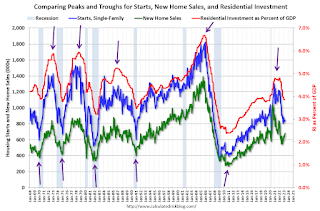 The arrows point to some of the earlier peaks and troughs for these three measures - and the most recent peak.
New home sales peaked in 2020 as pandemic buying soared. Then new home sales and single-family starts turned down in 2021, but that was partly due to the huge surge in sales during the pandemic. In 2022, both new home sales and single-family starts turned down in response to higher mortgage rates. Residential investment has also peaked.
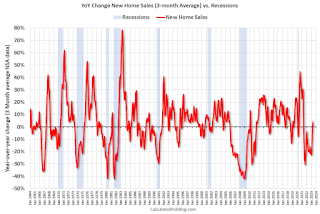 This third graph shows the YoY change in New Home Sales from the Census Bureau. Currently new home sales (based on 3-month average) are up 4% year-over-year!
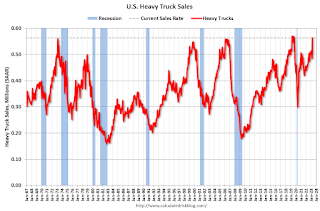
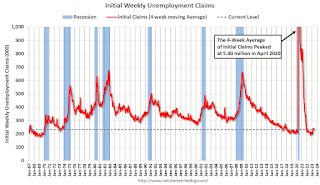 A short term leading indicator I'll be watching is the 4-week average of unemployment claims.
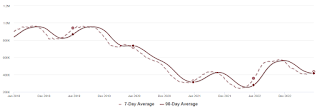
Housing May 29th Weekly Update: Inventory Increased 2.1% Week-over-week
by Calculated Risk on 5/29/2023 09:15:00 AM
 Click on graph for larger image.
This inventory graph is courtesy of Altos Research.

Sunday, May 28, 2023
Hotels: Occupancy Rate Down 1.5% Year-over-year
by Calculated Risk on 5/28/2023 10:32:00 AM
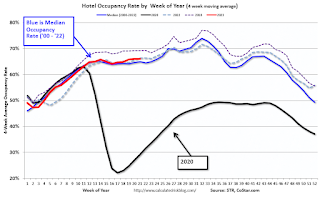
U.S. hotel performance increased from the previous week and showed improved comparisons year over year, according to STR‘s latest data through 20 May.The following graph shows the seasonal pattern for the hotel occupancy rate using the four-week average.
14-20 May 2023 (percentage change from comparable week in 2022):
• Occupancy: 67.5% (-1.5%)
• Average daily rate (ADR): US$158.53 (+3.6%)
• Revenue per available room (RevPAR): US$106.98 (+2.1%)
emphasis added
 Click on graph for larger image.
The red line is for 2023, black is 2020, blue is the median, and dashed light blue is for 2022. Dashed purple is for 2018, the record year for hotel occupancy.
Saturday, May 27, 2023
Real Estate Newsletter Articles this Week: "Multi-Family Delinquencies Increased"
by Calculated Risk on 5/27/2023 02:11:00 PM
At the Calculated Risk Real Estate Newsletter this week:
• New Home Sales at 683,000 Annual Rate in April
• Two Key Housing Themes: Low Inventory and Few Distressed Sales
• Total Housing Completions will Likely Decrease Slightly in 2023; The Mix will Change
• Fannie and Freddie Serious Delinquencies in April: Single Family Declined, Multi-Family Increased
• Final Look at Local Housing Markets in April
This is usually published 4 to 6 times a week and provides more in-depth analysis of the housing market.
You can subscribe at https://calculatedrisk.substack.com/
Most content is available for free (and no Ads), but please subscribe!
Schedule for Week of May 28, 2023
by Calculated Risk on 5/27/2023 08:11:00 AM
The key report scheduled for this week is the May employment report.
Other key reports include the March Case-Shiller house prices, May ISM Manufacturing and May Vehicle Sales.
All US markets will be closed in observance of Memorial Day.
 9:00 AM: S&P/Case-Shiller House Price Index for March.
This graph shows the year-over-year change in the seasonally adjusted National Index, Composite 10 and Composite 20 indexes through the most recent report (the Composite 20 was started in January 2000).
9:00 AM: FHFA House Price Index for March 2022. This was originally a GSE only repeat sales, however there is also an expanded index.
10:00 AM: Dallas Fed Survey of Manufacturing Activity for May.
7:00 AM ET: The Mortgage Bankers Association (MBA) will release the results for the mortgage purchase applications index.
9:45 AM: Chicago Purchasing Managers Index for May.
 10:00 AM ET: Job Openings and Labor Turnover Survey for April from the BLS.
 This graph shows job openings (black line), hires (purple), Layoff, Discharges and other (red column), and Quits (light blue column) from the JOLTS.
Jobs openings decreased in March to 9.6 million from 10.0 million in February. The number of job openings (black) were down 20% year-over-year.
2:00 PM: the Federal Reserve Beige Book, an informal review by the Federal Reserve Banks of current economic conditions in their Districts.
8:15 AM: The ADP Employment Report for May. This report is for private payrolls only (no government). The consensus is for 160,000 payroll jobs added in May, down from 296,000 in April.
8:30 AM: The initial weekly unemployment claims report will be released. The consensus is for 234 thousand initial claims, up from 229 thousand last week.
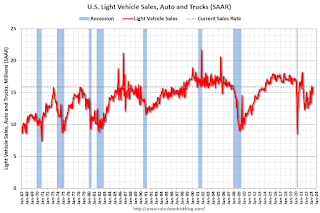 All day: Light vehicle sales for May. The consensus is for light vehicle sales to be 14.5 million SAAR in May, up from 14.3 million in April (Seasonally Adjusted Annual Rate).
10:00 AM: ISM Manufacturing Index for May. The consensus is for the ISM to be at 47.0, down from 47.1 in April.
10:00 AM: Construction Spending for April. The consensus is for a 0.2% increase in construction spending.
 8:30 AM: Employment Report for May. The consensus is for 180,000 jobs added, and for the unemployment rate to increase to 3.5%.
There were 253,000 jobs added in April, and the unemployment rate was at 3.4%.
This graph shows the jobs added per month since January 2021.


