by Calculated Risk on 6/01/2023 09:01:00 PM
Thursday, June 01, 2023
Friday: Employment Report

Friday:
• At 8:30 AM ET, Employment Report for May. The consensus is for 180,000 jobs added, and for the unemployment rate to increase to 3.5%.
U.S. Births decreased Slightly in 2022
by Calculated Risk on 6/01/2023 03:00:00 PM
From the National Center for Health Statistics: Births: Provisional Data for 2022. The NCHS reports:
The provisional number of births for the United States in 2022 was 3,661,220, a nonsignificant decline from 2021. The general fertility rate was 56.1 births per 1,000 women aged 15–44, down less than 1% from 2021. The total fertility rate was 1,665.0 births per 1,000 women in 2022, essentially unchanged from 2021. Birth rates declined for women in age groups 15–24 and 30–34, rose for women in age groups 25–29 and 35–49, and were unchanged for females aged 10–14 years in 2022. The birth rate for teenagers aged 15–19 declined by 3% in 2022 to 13.5 births per 1,000 females; rates declined for both younger (aged 15–17) and older (aged 18–19) teenagers.Here is a long-term graph of annual U.S. births through 2022.
emphasis added
 Click on graph for larger image.
Births had declined for six consecutive years, before increasing in 2021. The decline in 2022 was not significant.
Note the amazing decline in teenage births.
There is much more in the report.
May Employment Preview
by Calculated Risk on 6/01/2023 02:34:00 PM
On Friday at 8:30 AM ET, the BLS will release the employment report for May. The consensus is for 180,000 jobs added, and for the unemployment rate to increase to 3.5%.
From BofA economists:
"For the May employment report, we forecast a 200k increase in nonfarm payrolls (NFP), which would be a downshift from the addition of 253k jobs in April. Still it would leave payroll growth well above levels needed to offset the pace of natural growth in the labor force, thereby putting downward pressure on the unemployment rate in an already tight labor market ... we expect the unemployment rate to remain at 3.4%"From Goldman Sachs following the strong ADP report:
According to the ADP report, private sector employment rose by 278k in May, 108k above consensus expectations and one of the stronger Big Data employment indicators in May. We left our nonfarm payroll forecast unchanged at +175k ahead of tomorrow’s release."• ADP Report: The ADP employment report showed 278,000 private sector jobs were added in May. This suggests job gains well above consensus expectations, however, in general, ADP hasn't been very useful in forecasting the BLS report.
• ISM Surveys: Note that the ISM services are diffusion indexes based on the number of firms hiring (not the number of hires). The ISM® manufacturing employment index increased in May to 51.4%, up from 50.2% last month. This would suggest about 10,000 jobs lost in manufacturing. The ADP report indicated 48,000 manufacturing jobs lost in May.
The ISM® services employment index for May has not been released yet.
• Unemployment Claims: The weekly claims report showed a decline in the number of initial unemployment claims during the reference week (includes the 12th of the month) from 246,000 in April to 225,000 in May. This suggests fewer layoffs in May than in April.
Construction Spending Increased 1.2% in April
by Calculated Risk on 6/01/2023 10:16:00 AM
From the Census Bureau reported that overall construction spending increased:
Construction spending during April 2023 was estimated at a seasonally adjusted annual rate of $1,908.4 billion, 1.2 percent above the revised March estimate of $1,885.0 billion. The April figure is 7.2 percent above the April 2022 estimate of $1,780.9 billion.Both private and public spending increased:
emphasis added
Spending on private construction was at a seasonally adjusted annual rate of $1,500.7 billion, 1.3 percent above the revised March estimate of $1,481.6 billion. ...
In April, the estimated seasonally adjusted annual rate of public construction spending was $407.7 billion, 1.1 percent above the revised March estimate of $403.4 billion.
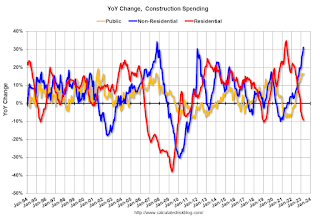
 Click on graph for larger image.
This graph shows private residential and nonresidential construction spending, and public spending, since 1993. Note: nominal dollars, not inflation adjusted.
Residential (red) spending is 10.5% below the recent peak.
Non-residential (blue) spending is at a new peak.
Public construction spending is at a new peak.
 The second graph shows the year-over-year change in construction spending.
On a year-over-year basis, private residential construction spending is down 9.2%. Non-residential spending is up 31.1% year-over-year. Public spending is up 16.5% year-over-year.
ISM® Manufacturing index Decreased to 46.9% in May
by Calculated Risk on 6/01/2023 10:03:00 AM
(Posted with permission). The ISM manufacturing index indicated contraction. The PMI® was at 46.9% in May, down from 47.1% in April. The employment index was at 51.4%, up from 50.2% last month, and the new orders index was at 42.6%, down from 45.7%.
From ISM: Manufacturing PMI® at 47.1%
May 2023 Manufacturing ISM® Report On Business®
Economic activity in the manufacturing sector contracted in May for the seventh consecutive month following a 28-month period of growth, say the nation's supply executives in the latest Manufacturing ISM® Report On Business®.This suggests manufacturing contracted in May. This was slightly above the consensus forecast.
The report was issued today by Timothy R. Fiore, CPSM, C.P.M., Chair of the Institute for Supply Management® (ISM®) Manufacturing Business Survey Committee:
“The May Manufacturing PMI® registered 46.9 percent, 0.2 percentage point lower than the 47.1 percent recorded in April. Regarding the overall economy, this figure indicates a sixth month of contraction after a 30-month period of expansion. The New Orders Index remained in contraction territory at 42.6 percent, 3.1 percentage points lower than the figure of 45.7 percent recorded in April. The Production Index reading of 51.1 percent is a 2.2-percentage point increase compared to April’s figure of 48.9 percent. The Prices Index registered 44.2 percent, down 9 percentage points compared to the April figure of 53.2 percent. The Backlog of Orders Index registered 37.5 percent, 5.6 percentage points lower than the April reading of 43.1 percent. The Employment Index indicated another month of expansion, registering 51.4 percent, up 1.2 percentage points from April’s reading of 50.2 percent. The Supplier Deliveries Index figure of 43.5 percent is 1.1 percentage points lower than the 44.6 percent recorded in April; this is the index’s lowest reading since March 2009 (43.2 percent). The Inventories Index dropped 0.5 percentage point to 45.8 percent; the April reading was 46.3 percent. The New Export Orders Index reading of 50 percent is 0.2 percentage point higher than April’s figure of 49.8 percent. The Imports Index remained in contraction territory, registering 47.3 percent, 2.6 percentage points lower the 49.9 percent reported in April.”
emphasis added
Inflation Adjusted House Prices 4.2% Below Peak; Price-to-rent index is 8.3% below recent peak
by Calculated Risk on 6/01/2023 09:00:00 AM
Today, in the Calculated Risk Real Estate Newsletter: Inflation Adjusted House Prices 4.2% Below Peak; Price-to-rent index is 8.3% below recent peak
Excerpt:
It has been 17 years since the bubble peak. In the February Case-Shiller house price index released Tuesday, the seasonally adjusted National Index (SA), was reported as being 62% above the bubble peak in 2006. However, in real terms, the National index (SA) is about 11% above the bubble peak (and historically there has been an upward slope to real house prices). The composite 20, in real terms, is at the bubble peak.
The inflation adjusted indexes increased in real terms in March using CPI ex-shelter. CPI less shelter has only increased at a 1.1% annual rate over the last six months, and that has kept real prices from falling even faster.
People usually graph nominal house prices, but it is also important to look at prices in real terms. As an example, if a house price was $200,000 in January 2000, the price would be $340,000 today adjusted for inflation (70% increase). That is why the second graph below is important - this shows "real" prices.
The third graph shows the price-to-rent ratio, and the fourth graph is the affordability index.
Weekly Initial Unemployment Claims increased to 232,000
by Calculated Risk on 6/01/2023 08:33:00 AM
The DOL reported:
In the week ending May 27, the advance figure for seasonally adjusted initial claims was 232,000, an increase of 2,000 from the previous week's revised level. The previous week's level was revised up by 1,000 from 229,000 to 230,000. The 4-week moving average was 229,500, a decrease of 2,500 from the previous week's revised average. The previous week's average was revised up by 250 from 231,750 to 232,000.The following graph shows the 4-week moving average of weekly claims since 1971.
emphasis added
 Click on graph for larger image.
The dashed line on the graph is the current 4-week average. The four-week average of weekly unemployment claims was decreased to 229,500.
The previous week was revised up.
Weekly claims were below the consensus forecast.
ADP: Private Employment Increased 278,000 in May
by Calculated Risk on 6/01/2023 08:20:00 AM
Private sector employment increased by 278,000 jobs in May and annual pay was up 6.5 percent year-over-year, according to the May ADP® National Employment ReportTM produced by the ADP Research Institute® in collaboration with the Stanford Digital Economy Lab (“Stanford Lab”).This was way above the consensus forecast of 160,000. The BLS report will be released Friday, and the consensus is for 180 thousand non-farm payroll jobs added in May.
...
“This is the second month we've seen a full percentage point decline in pay growth for job changers,” said Nela Richardson, chief economist, ADP. “Pay growth is slowing substantially, and wage-driven inflation may be less of a concern for the economy despite robust hiring.”
emphasis added
Wednesday, May 31, 2023
Thursday: ADP Employment, Unemployment Claims, ISM Mfg, Construction Spending, Vehicle Sales
by Calculated Risk on 5/31/2023 09:00:00 PM

Thursday:
• At 8:15 AM ET, The ADP Employment Report for May. This report is for private payrolls only (no government). The consensus is for 160,000 payroll jobs added in May, down from 296,000 in April.
• At 8:30 AM, The initial weekly unemployment claims report will be released. The consensus is for 234 thousand initial claims, up from 229 thousand last week.
• At 10:00 AM, ISM Manufacturing Index for May. The consensus is for the ISM to be at 47.0, down from 47.1 in April.
• Also, at 10:00 AM, Construction Spending for April. The consensus is for a 0.2% increase in construction spending.
• All day, Light vehicle sales for May. The consensus is for light vehicle sales to be 14.5 million SAAR in May, up from 14.3 million in April (Seasonally Adjusted Annual Rate).
Freddie Mac House Price Index Increased Slightly in April; Up 0.3% Year-over-year
by Calculated Risk on 5/31/2023 07:43:00 PM
Today, in the Calculated Risk Real Estate Newsletter: Freddie Mac House Price Index Increased Slightly in April; Up 0.3% Year-over-year
A brief excerpt:
Freddie Mac reported that its “National” Home Price Index (FMHPI) increased 0.3% month-over-month on a seasonally adjusted (SA) basis in April, putting the National FMHPI down 0.9% SA from its June 2022 peak, and down 1.2% Not Seasonally Adjusted (NSA) from the peak.There is much more in the article. You can subscribe at https://calculatedrisk.substack.com/
On a year-over-year basis, the National FMHPI was up 0.3% in April, from up 1.2% YoY in March. The YoY increase peaked at 19.2% in July 2021. ...
In April, 22 states and D.C. were below their 2022 peaks, Seasonally Adjusted. The largest seasonally adjusted declines from the recent peak were in Nevada (-7.6%), Idaho (-7.2%), Utah (-6.2%), Arizona (-6.0%), Washington (-5.9%), D.C. (-5.5%), California (-5.3%), and Wyoming (-5.0%).
For cities (Core-based Statistical Areas, CBSA), here are the 30 cities with the largest declines from the peak, seasonally adjusted.


