by Calculated Risk on 6/03/2023 08:11:00 AM
Saturday, June 03, 2023
Schedule for Week of June 4, 2023
The key report scheduled for this week is the April trade balance.
10:00 AM: the ISM Services Index for May. The consensus is for a reading of 52.5, up from 51.9.
8:00 AM ET: CoreLogic House Price index for April.
7:00 AM ET: The Mortgage Bankers Association (MBA) will release the results for the mortgage purchase applications index.
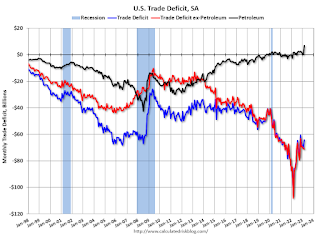 8:30 AM: Trade Balance report for April from the Census Bureau.
 This graph shows the U.S. trade deficit, with and without petroleum.
The consensus is the trade deficit to be $75.4 billion. The U.S. trade deficit was at $64.2 Billion in March.
8:30 AM: The initial weekly unemployment claims report will be released. The consensus is for 238 thousand initial claims, up from 232 thousand last week.
12:00 PM: Q1 Flow of Funds Accounts of the United States from the Federal Reserve.
No major economic releases scheduled.
Friday, June 02, 2023
June 2nd COVID Update: New Pandemic Lows for Deaths and Hospitalizations
by Calculated Risk on 6/02/2023 09:10:00 PM

| COVID Metrics | ||||
|---|---|---|---|---|
| Now | Week Ago | Goal | ||
| Hospitalized2 | 6,942 | 7,544 | ≤3,0001 | |
| Deaths per Week2 | 684 | 849 | ≤3501 | |
| 1my goals to stop weekly posts, 2Weekly for Currently Hospitalized, and Deaths 🚩 Increasing number weekly for Hospitalized and Deaths ✅ Goal met. | ||||
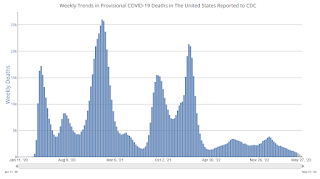 Click on graph for larger image.
This graph shows the weekly (columns) number of deaths reported.
Heavy Truck Sales Up Sharply Year-over-year in May
by Calculated Risk on 6/02/2023 03:08:00 PM
This graph shows heavy truck sales since 1967 using data from the BEA. The dashed line is the May 2023 seasonally adjusted annual sales rate (SAAR).
Heavy truck sales really collapsed during the great recession, falling to a low of 180 thousand SAAR in May 2009. Then heavy truck sales increased to a new all-time high of 570 thousand SAAR in April 2019.
 Click on graph for larger image.
Note: "Heavy trucks - trucks more than 14,000 pounds gross vehicle weight."
Heavy truck sales declined sharply at the beginning of the pandemic, falling to a low of 308 thousand SAAR in May 2020.
Year-over-year Rent Growth Continues to Decelerate; Asking Rents Likely to be Down year-over-year in June or July
by Calculated Risk on 6/02/2023 11:59:00 AM
Today, in the Calculated Risk Real Estate Newsletter: Year-over-year Rent Growth Continues to Decelerate
A brief excerpt:
Tracking rents is important for understanding the dynamics of the housing market. For example, the sharp increase in rents helped me deduce that there was a surge in household formation in 2021 (See from September 2021: Household Formation Drives Housing Demand). This has been confirmed (mostly due to work-from-home), and also led to the supposition that household formation would slow sharply now (mostly confirmed) and that asking rents might decrease in 2023 on a year-over-year basis.There is much more in the article. You can subscribe at https://calculatedrisk.substack.com/
...
Here is a graph of the year-over-year (YoY) change for these measures since January 2015. Most of these measures are through April 2023, except CoreLogic is through May and Apartment List is through May 2023.
...
The CoreLogic measure is up 4.3% YoY in March, down from 5.0% in February, and down from a peak of 13.9% in April 2022.
The Zillow measure is up 5.3% YoY in April, down from 6.0% YoY in March, and down from a peak of 16.9% YoY in February 2022.
The ApartmentList measure is up 0.9% YoY as of May, down from 1.8% in April, and down from a peak of 18.3% YoY November 2021.
...
My view is it is likely that we will see a year-over-year decline in asking rents sometime in the next couple of months.
Vehicles Sales at 15.05 million SAAR in May; Up 19.6% YoY
by Calculated Risk on 6/02/2023 11:01:00 AM
The BEA estimates sales of 15.05 million SAAR in May 2023 (Seasonally Adjusted Annual Rate), down 6.5% from the April sales rate, and up 19.6% from May 2022.
 Click on graph for larger image.
This graph shows light vehicle sales since 2006 from the BEA (blue) and BEA's estimate for May (red).
The impact of COVID-19 was significant, and April 2020 was the worst month. After April 2020, sales increased, and were close to sales in 2019 (the year before the pandemic).
 The second graph shows light vehicle sales since the BEA started keeping data in 1967.
 Sales in May were above the consensus forecast and sales in April were revised up.
Comments on May Employment Report
by Calculated Risk on 6/02/2023 09:15:00 AM
The headline jobs number in the May employment report was above expectations, and employment for the previous two months was revised up by 93,000, combined. The participation rate was unchanged, the employment population ratio declined slightly, and the unemployment rate increased to 3.7%.
In May, the year-over-year employment change was 4.06 million jobs.
Prime (25 to 54 Years Old) Participation
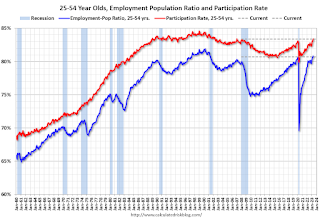 Since the overall participation rate is impacted by both cyclical (recession) and demographic (aging population, younger people staying in school) reasons, here is the employment-population ratio for the key working age group: 25 to 54 years old.
The 25 to 54 participation rate was increased in May to 83.4% from 83.3% in April, and the 25 to 54 employment population ratio decreased to 80.7% from 80.8% the previous month.
Average Hourly Wages
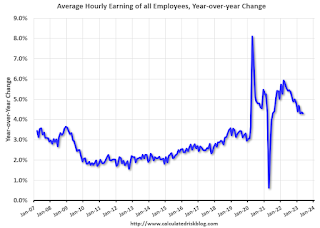 The graph shows the nominal year-over-year change in "Average Hourly Earnings" for all private employees from the Current Employment Statistics (CES).
 Wage growth has trended down after peaking at 5.9% YoY in March 2022 and was at 4.3% YoY in May.
Part Time for Economic Reasons
 From the BLS report:
"The number of persons employed part time for economic reasons, at 3.7 million, changed little in May. These individuals, who would have preferred full-time employment, were working part time because their hours had been reduced or they were unable to find full-time jobs."The number of persons working part time for economic reasons decreased in April to 3.739 million from 3.903 million in April. This is below pre-recession levels.
These workers are included in the alternate measure of labor underutilization (U-6) that increased to 6.7% from 6.6% in the previous month. This is down from the record high in April 22.9% and up slightly from the lowest level on record (seasonally adjusted) in December 2022 (6.5%). (This series started in 1994). This measure is below the level in February 2020 (pre-pandemic).
Unemployed over 26 Weeks
 This graph shows the number of workers unemployed for 27 weeks or more.
 According to the BLS, there are 1.188 million workers who have been unemployed for more than 26 weeks and still want a job, up from 1.156 million the previous month.
This is at pre-pandemic levels.
Summary:
The headline monthly jobs number was well above expectations, and employment for the previous two months was revised up by 93,000, combined.
May Employment Report: 339 thousand Jobs, 3.7% Unemployment Rate
by Calculated Risk on 6/02/2023 08:41:00 AM
From the BLS:
Total nonfarm payroll employment increased by 339,000 in May, and the unemployment rate rose by 0.3 percentage point to 3.7 percent, the U.S. Bureau of Labor Statistics reported today. Job gains occurred in professional and business services, government, health care, construction, transportation and warehousing, and social assistance.
...
The change in total nonfarm payroll employment for March was revised up by 52,000, from +165,000 to +217,000, and the change for April was revised up by 41,000, from +253,000 to +294,000. With these revisions, employment in March and April combined is 93,000 higher than previously reported.
emphasis added
 Click on graph for larger image.
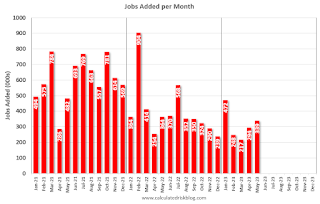
The first graph shows the jobs added per month since January 2021.
Payrolls for March and April were revised up 93 thousand, combined.
 The second graph shows the year-over-year change in total non-farm employment since 1968.
In May, the year-over-year change was 4.06 million jobs. Employment was up significantly year-over-year.
The third graph shows the employment population ratio and the participation rate.
 The Labor Force Participation Rate was unchanged at 62.6% in May, from 62.6% in April. This is the percentage of the working age population in the labor force.
 The Employment-Population ratio declined to 60.3% from 60.4% (blue line).I'll have more later ...
Thursday, June 01, 2023
Friday: Employment Report
by Calculated Risk on 6/01/2023 09:01:00 PM
Friday:
• At 8:30 AM ET, Employment Report for May. The consensus is for 180,000 jobs added, and for the unemployment rate to increase to 3.5%.
U.S. Births decreased Slightly in 2022
by Calculated Risk on 6/01/2023 03:00:00 PM
From the National Center for Health Statistics: Births: Provisional Data for 2022. The NCHS reports:
The provisional number of births for the United States in 2022 was 3,661,220, a nonsignificant decline from 2021. The general fertility rate was 56.1 births per 1,000 women aged 15–44, down less than 1% from 2021. The total fertility rate was 1,665.0 births per 1,000 women in 2022, essentially unchanged from 2021. Birth rates declined for women in age groups 15–24 and 30–34, rose for women in age groups 25–29 and 35–49, and were unchanged for females aged 10–14 years in 2022. The birth rate for teenagers aged 15–19 declined by 3% in 2022 to 13.5 births per 1,000 females; rates declined for both younger (aged 15–17) and older (aged 18–19) teenagers.Here is a long-term graph of annual U.S. births through 2022.
emphasis added
 Click on graph for larger image.
Births had declined for six consecutive years, before increasing in 2021. The decline in 2022 was not significant.
Note the amazing decline in teenage births.
There is much more in the report.
May Employment Preview
by Calculated Risk on 6/01/2023 02:34:00 PM
On Friday at 8:30 AM ET, the BLS will release the employment report for May. The consensus is for 180,000 jobs added, and for the unemployment rate to increase to 3.5%.
From BofA economists:
"For the May employment report, we forecast a 200k increase in nonfarm payrolls (NFP), which would be a downshift from the addition of 253k jobs in April. Still it would leave payroll growth well above levels needed to offset the pace of natural growth in the labor force, thereby putting downward pressure on the unemployment rate in an already tight labor market ... we expect the unemployment rate to remain at 3.4%"From Goldman Sachs following the strong ADP report:
According to the ADP report, private sector employment rose by 278k in May, 108k above consensus expectations and one of the stronger Big Data employment indicators in May. We left our nonfarm payroll forecast unchanged at +175k ahead of tomorrow’s release."• ADP Report: The ADP employment report showed 278,000 private sector jobs were added in May. This suggests job gains well above consensus expectations, however, in general, ADP hasn't been very useful in forecasting the BLS report.
• ISM Surveys: Note that the ISM services are diffusion indexes based on the number of firms hiring (not the number of hires). The ISM® manufacturing employment index increased in May to 51.4%, up from 50.2% last month. This would suggest about 10,000 jobs lost in manufacturing. The ADP report indicated 48,000 manufacturing jobs lost in May.
The ISM® services employment index for May has not been released yet.
• Unemployment Claims: The weekly claims report showed a decline in the number of initial unemployment claims during the reference week (includes the 12th of the month) from 246,000 in April to 225,000 in May. This suggests fewer layoffs in May than in April.


