by Calculated Risk on 6/07/2023 11:52:00 AM
Wednesday, June 07, 2023
Could 6% to 7% 30-Year Mortgage Rates be the "New Normal"?
Today, in the Calculated Risk Real Estate Newsletter: Could 6% to 7% 30-Year Mortgage Rates be the "New Normal"?
A brief excerpt:
A key pitch, by real estate agents for home buyers right now, is that they will likely be able to refinance at a lower mortgage rate in a few years. The argument is that once the Federal Reserve has inflation back down to the 2% target, 30-mortgage rates will decline, perhaps to around 5% or lower. Of course, no one expects to see 3% mortgage rates without another crisis.There is much more in the article. You can subscribe at https://calculatedrisk.substack.com/
This graph is from Mortgage News Daily and shows the 30-year mortgage rate since 2010. Rates were mostly in the 3.5% to 5% range for over a decade prior to the pandemic, but it is possible - without a recession or a crisis - that 6% to 7% mortgage rates could be the new normal.
Wholesale Used Car Prices Decreased in May; Down 7.6% Year-over-year
by Calculated Risk on 6/07/2023 10:05:00 AM
From Manheim Consulting today: Wholesale Used-Vehicle Prices See Continued Declines in May
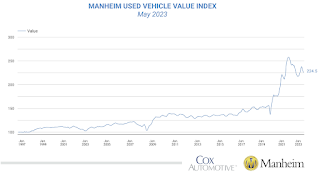
Wholesale used-vehicle prices (on a mix, mileage, and seasonally adjusted basis) decreased 2.7% in May from April. The Manheim Used Vehicle Value Index (MUVVI) declined to 224.5, down 7.6% from a year ago.
“Price erosion continued in May, with another month-over-month drop in the index bringing it 0.3 points below our January result,” said Chris Frey, senior manager of Economic and Industry insights for Cox Automotive. “Taking a longer view, May’s year-over-year decline accelerated from April and March; however, the rate of decline might slow over the next several months as we encounter the lower prices seen at auction from May through November last year. Two consecutive reads in either measure do not a trend make, as used retail inventory is still below last year, and that tends to keep buyers at the auction, supporting prices.”
emphasis added
 Click on graph for larger image.
This index from Manheim Consulting is based on all completed sales transactions at Manheim’s U.S. auctions.
Trade Deficit Increased to $74.6 Billion in April
by Calculated Risk on 6/07/2023 08:50:00 AM
The Census Bureau and the Bureau of Economic Analysis reported:
The U.S. Census Bureau and the U.S. Bureau of Economic Analysis announced today that the goods and services deficit was $74.6 billion in April, up $14.0 billion from $60.6 billion in March, revised.
April exports were $249.0 billion, $9.2 billion less than March exports. April imports were $323.6 billion, $4.8 billion more than March imports.
emphasis added
 Click on graph for larger image.
Exports decreased and imports increased in April.
Exports are down 1% year-over-year; imports are down 4% year-over-year.
Both imports and exports decreased sharply due to COVID-19 and then bounced back - and both have been decreasing recently.
The second graph shows the U.S. trade deficit, with and without petroleum.
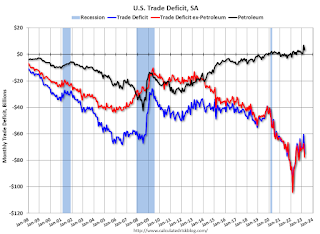 The blue line is the total deficit, and the black line is the petroleum deficit, and the red line is the trade deficit ex-petroleum products.
Note that net, exports of petroleum products are positive and have picked up.
The trade deficit with China decreased to $20.3 billion in March, from $30.4 billion a year ago.
MBA: Mortgage Applications Decreased in Weekly Survey
by Calculated Risk on 6/07/2023 07:00:00 AM
From the MBA: Mortgage Applications Decrease in Latest MBA Weekly Survey
Mortgage applications decreased 1.4 percent from one week earlier, according to data from the Mortgage Bankers Association’s (MBA) Weekly Mortgage Applications Survey for the week ending June 2, 2023. This week’s results include an adjustment for the Memorial Day holiday.
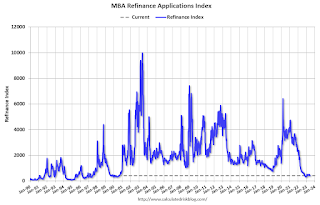
The Market Composite Index, a measure of mortgage loan application volume, decreased 1.4 percent on a seasonally adjusted basis from one week earlier. On an unadjusted basis, the Index decreased 12 percent compared with the previous week. The Refinance Index decreased 1 percent from the previous week and was 42 percent lower than the same week one year ago. The seasonally adjusted Purchase Index decreased 2 percent from one week earlier. The unadjusted Purchase Index decreased 13 percent compared with the previous week and was 27 percent lower than the same week one year ago.
“Mortgage rates declined last week from a recent high, but total application activity slipped for the fourth straight week. The 30-year fixed rate dipped to 6.81 percent, 10 basis points lower than last week but still the second highest rate of 2023 to date,” said Joel Kan, MBA’s Vice President and Deputy Chief Economist. “Overall applications were more than 30 percent lower than a year ago, as borrowers continue to grapple with the higher rate environment. Purchase activity is constrained by reduced purchasing power from higher rates and the ongoing lack of for-sale inventory in the market, while there continues to be very little rate incentive for refinance borrowers. There was less of a decline in government purchase applications last week, which was consistent with a growing share of first-time home buyers in the market.”
...
The average contract interest rate for 30-year fixed-rate mortgages with conforming loan balances ($726,200 or less) decreased to 6.81 percent from 6.91 percent, with points decreasing to 0.66 from 0.83 (including the origination fee) for 80 percent loan-to-value ratio (LTV) loans
emphasis added
 Click on graph for larger image.
The first graph shows the MBA mortgage purchase index.
According to the MBA, purchase activity is down 27% year-over-year unadjusted.
Tuesday, June 06, 2023
Wednesday: Trade Deficit
by Calculated Risk on 6/06/2023 08:22:00 PM
Wednesday:
• At 7:00 AM ET, The Mortgage Bankers Association (MBA) will release the results for the mortgage purchase applications index.
• At 8:30 AM, Trade Balance report for April from the Census Bureau. The consensus is the trade deficit to be $75.4 billion. The U.S. trade deficit was at $64.2 Billion in March.
Second Home Market: South Lake Tahoe in May
by Calculated Risk on 6/06/2023 01:12:00 PM
With the pandemic, there was a surge in 2nd home buying.
I'm looking at data for some second home markets - and I'm tracking those markets to see if there is an impact from lending changes, rising mortgage rates or the easing of the pandemic.
This graph is for South Lake Tahoe since 2004 through May 2023, and shows inventory (blue), and the year-over-year (YoY) change in the median price (12-month average).
Note: The median price is a 12-month average, and is distorted by the mix, but this is the available data.

Following the housing bubble, prices declined for several years in South Lake Tahoe, with the median price falling about 50% from the bubble peak.
Currently active inventory is still very low and is down 32% year-over-year.
Early Look at Local Housing Markets in May
by Calculated Risk on 6/06/2023 10:15:00 AM
Today, in the Calculated Risk Real Estate Newsletter: Early Look at Local Housing Markets in May
A brief excerpt:
This is a look at a few early reporting local markets in May. I’m tracking about 40 local housing markets in the US. Some of the 40 markets are states, and some are metropolitan areas. I’ll update these tables throughout the month as additional data is released.There is much more in the article. You can subscribe at https://calculatedrisk.substack.com/
Closed sales in May were mostly for contracts signed in March and April. Since 30-year fixed mortgage rates were in the 6% to 6.5% range in March and April - compared to the 4% to 5% range the previous year - closed sales were down significantly year-over-year in May.
...
In May, sales in these markets were down 26.6%. In April, these same markets were down 34.4% YoY Not Seasonally Adjusted (NSA).
This is a smaller YoY decline NSA than in April for these early reporting markets, however seasonally adjusted, it is closer. Note that there was one less selling day in April this year than in April 2022, but the same number of selling days each year in May.
Another factor in the smaller YoY decline was that sales were steadily declining last year due to higher mortgage rates. ...
This was a just a few early reporting markets. Many more local markets to come!
CoreLogic: House Prices up 2.0% YoY in April
by Calculated Risk on 6/06/2023 08:11:00 AM
Notes: This CoreLogic House Price Index report is for April. The recent Case-Shiller index release was for March. The CoreLogic HPI is a three-month weighted average and is not seasonally adjusted (NSA).
From CoreLogic: CoreLogic: Home Price Growth Continues Annual Single-Digit Slowdown in April
CoreLogic® ... today released the CoreLogic Home Price Index (HPI™) and HPI Forecast™ for April 2023.This index was up 3.1% YoY in March.
Nationwide, single-family home price growth rose by 2% year over year in April. This marked the 135th consecutive month of annual growth but the sixth straight month of single-digit gains, which have slowed from an all-time high of nearly 20% annual appreciation in the spring of 2022.
Numerous economic concerns are contributing to buyer reluctance, including mortgage rate volatility and the related uncertainty surrounding the recent debt-ceiling debate. That said, a continued shortage of homes for sale could keep pressure on housing prices over the next 12 months. CoreLogic projects that home price growth will slow a bit more in 2023 before regaining steam to about 5% annual appreciation by April 2024.
“While mortgage rate volatility continues to cause buyer hesitation, the lack of for-sale homes is putting firm pressure on prices this spring, leading to above-average seasonal monthly gains and a rebound in home prices in most markets,” said CoreLogic Chief Economist Selma Hepp. ”Nevertheless, the recent surge in mortgage rates and continued inflation issues suggest that rates may remain elevated, leading home price appreciation to possibly relax this summer and return to average seasonal gains later in 2023.”
“Still, while slim inventory is pushing prices up once again and constraining affordability,” Hepp continued, “recent trends suggest that home price growth in 2023 will fall in line with the historical 4% annual average.“
...
U.S. home prices (including distressed sales) increased by 2% year over year in April 2023 compared with April 2022. On a month-over-month basis, home prices increased by 1.2% compared with March 2023.
emphasis added
Monday, June 05, 2023
Tuesday: CoreLogic House Prices
by Calculated Risk on 6/05/2023 08:11:00 PM
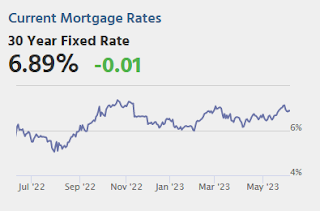
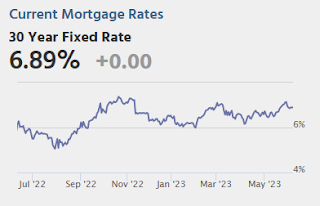
Mortgage rates held fairly steady over the weekend. That wasn't necessarily destined to be the case as the underlying bond market suggested another mover higher earlier this morning. But bonds rallied after an important economic report on the services sector suggested slower growth (bonds tend to improve in response to weaker cues on the economy and inflation). ... With the next major inflation report (CPI) and the next Fed rate announcement on Tuesday and Wednesday next week, rates might not be inclined to make a big run in either direction between now and then. [30 year fixed 6.89%]Tuesday:
emphasis added
• At 8:00 AM ET, CoreLogic House Price index for April.
ISM® Services Index Decreases to 50.3% in May
by Calculated Risk on 6/05/2023 12:52:00 PM
(Posted with permission). The ISM® Services index was at 50.3%, down from 51.9% last month. The employment index decreased to 49.2%, from 50.8%. Note: Above 50 indicates expansion, below 50 in contraction.
From the Institute for Supply Management: Services PMI® at 50.3% May 2023 Services ISM® Report On Business®
Economic activity in the services sector expanded in May for the fifth consecutive month as the Services PMI® registered 50.3 percent, say the nation's purchasing and supply executives in the latest Services ISM® Report On Business®. The sector has grown in 35 of the last 36 months, with the lone contraction in December of last year.The PMI was below expectations.
The report was issued today by Anthony Nieves, CPSM, C.P.M., A.P.P., CFPM, Chair of the Institute for Supply Management® (ISM®) Services Business Survey Committee: “In May, the Services PMI® registered 50.3 percent, 1.6 percentage points lower than April’s reading of 51.9 percent. The composite index indicated growth in May for the fifth consecutive month after a reading of 49.2 percent in December, which was the first contraction since May 2020 (45.4 percent). The Business Activity Index registered 51.5 percent, a 0.5-percentage point decrease compared to the reading of 52 percent in April. The New Orders Index expanded in May for the fifth consecutive month after contracting in December for the first time since May 2020; the figure of 52.9 percent is 3.2 percentage points lower than the April reading of 56.1 percent.
“The Supplier Deliveries registered 47.7 percent, 0.9 percentage point lower than the 48.6 percent recorded in April. In the last six months, the average reading of 48.0 percent (with a low of 45.8 percent in March) reflects the fastest supplier delivery performance since June 2009, when the index registered 46 percent. (Supplier Deliveries is the only ISM® Report On Business® index that is inversed; a reading of above 50 percent indicates slower deliveries, which is typical as the economy improves and customer demand increases.)
“The Prices Index was down 3.4 percentage points in May, to 56.2 percent. The Inventories Index expanded in May after a month of contraction and two previous months of growth, preceded by eight straight months of contraction; the reading of 58.3 percent is up 11.1 percentage points from April’s figure of 47.2 percent. The Inventory Sentiment Index (61 percent, up 12.1 percentage points from April’s reading of 48.9 percent) expanded after a month of contraction preceded by four months of growth, with a four-month period of contraction before that. The Backlog of Orders Index registered 40.9 percent, an 8.8-percentage point decrease compared to the April figure of 49.7 percent and the index’s lowest reading since May 2009 (40 percent).
emphasis added


