 RSS Feed
 by Calculated Risk on 6/09/2023 10:23:00 AM
Friday, June 09, 2023
Lawler: Census 2020, Population Estimates, and Population Projections: Challenges for Demographers
Today, in the Real Estate Newsletter: Lawler: Census 2020, Population Estimates, and Population Projections: Challenges for Demographers
Excerpt:
CR Note: Demographics are useful in making economic projections, especially for housing. Demographic changes helped me call the bottom for rents in 2010 / 2011 and helped me predict the recent homebuying boom. For example, from 2016, see: Demographics: Renting vs. Owning.There is much more in the article. You can subscribe at https://calculatedrisk.substack.com/.
In this note, housing economist Tom Lawler discusses some of the current challenges for demographers. This is a bit technical.
From Tom Lawler:
Each year Census produces estimates of the US resident population, both totals and characteristics of the population (age, sex, race/ethnicity, etc.). Population estimates are basically “walk-forwards” from a “base” population year, using estimates of births, deaths, and net international migration to produce population estimates for years subsequent to the “base” year.
The starting point for population estimates has always been the same date as that of last decennial census, and historically Census has used the decennial census population results as the “base” population from which to generate population estimates for subsequent years. It has done so even when post-census analysis or demographic analysis has suggested that the “true” characteristics of the population were different from the decennial census results.
For the most recent Census population estimates, however, it was not possible to use decennial census results because processing/other issues significantly delayed the availability of the detailed census 2020 demographic data, which were just released last month. (There were a few other issues as well.).
Hotels: Occupancy Rate Down 2.3% Year-over-year
by Calculated Risk on 6/09/2023 08:49:00 AM
As expected with the Memorial Day holiday, U.S. hotel performance decreased from the previous week, according to STR‘s latest data through 3 June.The following graph shows the seasonal pattern for the hotel occupancy rate using the four-week average.
28 May through 3 June 2023 (percentage change from comparable week in 2022):
• Occupancy: 61.6% (-2.3%)
• Average daily rate (ADR): US$150.28 (+1.3%)
• Revenue per available room (RevPAR): US$92.55 (-1.0%)
emphasis added
 Click on graph for larger image.
The red line is for 2023, black is 2020, blue is the median, and dashed light blue is for 2022. Dashed purple is for 2018, the record year for hotel occupancy.
The 4-week average of the occupancy rate is at the median rate for the period 2000 through 2022 (Blue).
Note: Y-axis doesn't start at zero to better show the seasonal change.
The 4-week average of the occupancy rate will increase during the summer travel season.
Thursday, June 08, 2023
Realtor.com Reports Weekly Active Inventory Up 13% YoY; New Listings Down 25% YoY
by Calculated Risk on 6/08/2023 04:02:00 PM
Realtor.com has monthly and weekly data on the existing home market. Here is their weekly report from economist Jiayi Xu: Weekly Housing Trends View — Data Week Ending June 3rd, 2023
• ctive inventory growth slowed again, with for-sale homes up just 13% above one year ago. The number of homes for sale continues to grow, but compared to one year ago, the pace is slowing. While today’s shoppers still have many more homes to consider than last year’s shoppers did, worries about high inflation, rising interest rates, and escalating home prices have caused many prospective buyers, especially more first-time buyers, to postpone their plans to purchase a home. This, in turn, has contributed to an increase in the number of homes listed for sale. However, the ongoing decrease in new listings has restrained the growth of active inventory, and there is a possibility of further deceleration in the upcoming weeks.
...
• New listings–a measure of sellers putting homes up for sale–were down again this week, by 25% from one year ago. The number of newly listed homes has been lower than the same time the previous year for the past 48 weeks. The fluctuations in the decline of new listings indicate that sellers are exercising caution in their selling decisions, likely due to being locked into mortgage rates that are significantly lower than the current rates.
 Here is a graph of the year-over-year change in inventory according to realtor.com.
 Inventory is still up year-over-year - from record lows - however, the YoY increase has slowed sharply recently.
This was the smallest YoY increase since June 2022.
The recent trend suggests active inventory could be down YoY in late June!
The "Home ATM" was Closed in Q1; Mortgage Equity Withdrawal (MEW) turns negative in Q1 2023
by Calculated Risk on 6/08/2023 01:26:00 PM
Today, in the Real Estate Newsletter: The "Home ATM" was Closed in Q1
Excerpt:
For Q1 2023, the Net Equity Extraction was minus $30 billion, or -0.60% of Disposable Personal Income (DPI). This is down significantly year-over-year and the first negative reading since Q1 2020. There is a seasonal pattern to MEW, and Q1 is usually the weakest quarter, so it is possible we will see positive MEW this summer.There is much more in the article. You can subscribe at https://calculatedrisk.substack.com/.
During the housing bubble we saw several quarters with MEW above 8% of DPI - that didn’t happen this cycle.
This graph shows the net equity extraction, or mortgage equity withdrawal (MEW), results, using the Flow of Funds (and BEA data) compared to the Kennedy-Greenspan method. MEW was negative for a number of years but has picked up again following the onset of the pandemic.
The bottom line is, the “Home ATM” was closed in Q1 with both refinance activity and HELOC borrowing off sharply.

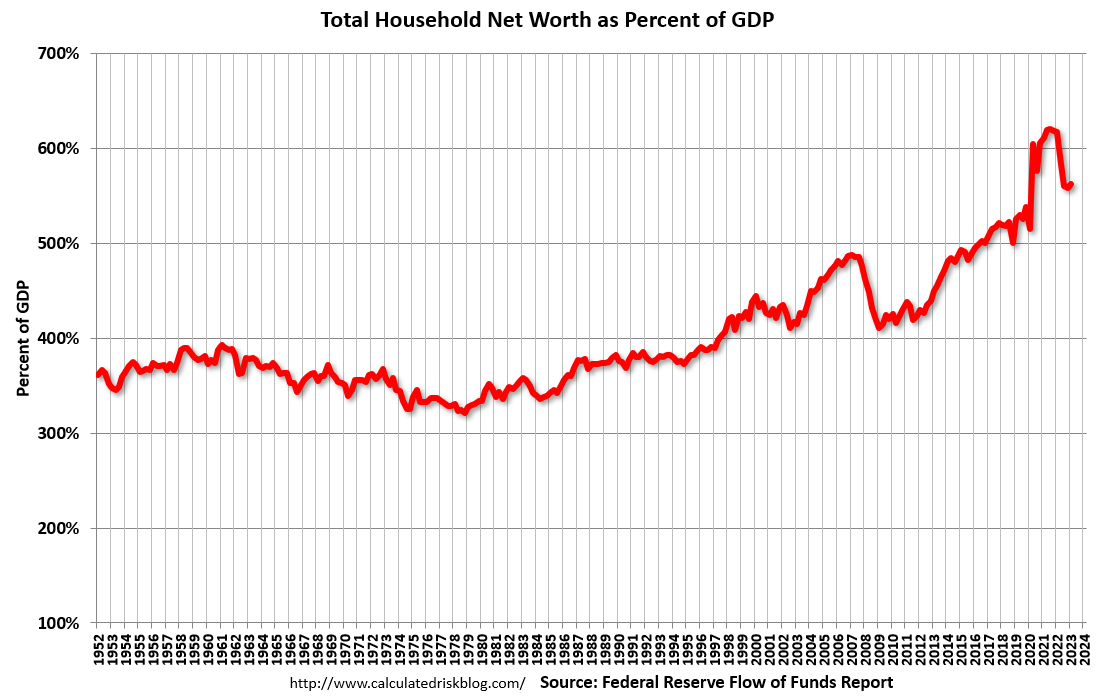
Fed's Flow of Funds: Household Net Worth Increased $3.0 Trillion in Q1
by Calculated Risk on 6/08/2023 12:16:00 PM
The Federal Reserve released the Q1 2023 Flow of Funds report today: Financial Accounts of the United States.
The net worth of households and nonprofits rose to $148.8 trillion during the first quarter of 2023. The value of directly and indirectly held corporate equities increased $2.4 trillion and the value of real estate decreased $0.6 trillion.
...
Household debt increased 2.2 percent at an annual rate in the first quarter of 2023. Consumer credit grew at an annual rate of 4.3 percent, while mortgage debt (excluding charge-offs) grew at an annual rate of 2.5 percent.
 Click on graph for larger image.
The first graph shows Households and Nonprofit net worth as a percent of GDP.
Net worth is down $3.8 trillion from the all-time high in Q1 2022.
This includes real estate and financial assets (stocks, bonds, pension reserves, deposits, etc) net of liabilities (mostly mortgages). Note that this does NOT include public debt obligations.
 The second graph shows homeowner percent equity since 1952.
Household percent equity (as measured by the Fed) collapsed when house prices fell sharply in 2007 and 2008.
In Q1 2023, household percent equity (of household real estate) was at 69.6% - down from 70.1% in Q4, 2022. This is close to the highest percent equity since the early 1980s.
Note: This includes households with no mortgage debt.
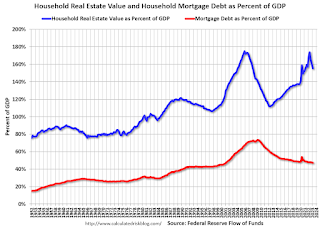 The third graph shows household real estate assets and mortgage debt as a percent of GDP. Note this graph was impacted by the sharp decline in Q2 2020 GDP.
Mortgage debt increased by $45 billion in Q1.
Mortgage debt is up $1.82 trillion from the peak during the housing bubble, but, as a percent of GDP is at 47.3% - down from Q4 - and down from a peak of 73.3% of GDP during the housing bust.
The value of real estate, as a percent of GDP, decreased in Q1 - after peaking in Q2 2022 - and is well above the average of the last 30 years.
 The second graph shows homeowner percent equity since 1952.
 Household percent equity (as measured by the Fed) collapsed when house prices fell sharply in 2007 and 2008.
In Q1 2023, household percent equity (of household real estate) was at 69.6% - down from 70.1% in Q4, 2022. This is close to the highest percent equity since the early 1980s.
Note: This includes households with no mortgage debt.
 The third graph shows household real estate assets and mortgage debt as a percent of GDP. Note this graph was impacted by the sharp decline in Q2 2020 GDP.
Mortgage debt increased by $45 billion in Q1.
Mortgage debt is up $1.82 trillion from the peak during the housing bubble, but, as a percent of GDP is at 47.3% - down from Q4 - and down from a peak of 73.3% of GDP during the housing bust.
The value of real estate, as a percent of GDP, decreased in Q1 - after peaking in Q2 2022 - and is well above the average of the last 30 years.
Weekly Initial Unemployment Claims increased to 261,000
by Calculated Risk on 6/08/2023 08:30:00 AM
The DOL reported:
In the week ending June 3, the advance figure for seasonally adjusted initial claims was 261,000, an increase of 28,000 from the previous week's revised level. This is the highest level for initial claims since October 30, 2021 when it was 264,000. The previous week's level was revised up by 1,000 from 232,000 to 233,000. The 4-week moving average was 237,250, an increase of 7,500 from the previous week's revised average. The previous week's average was revised up by 250 from 229,500 to 229,750.The following graph shows the 4-week moving average of weekly claims since 1971.
emphasis added
 Click on graph for larger image.
The dashed line on the graph is the current 4-week average. The four-week average of weekly unemployment claims was increased to 237,250.
The previous week was revised up.
Weekly claims were well above the consensus forecast.
CoreLogic: 1.2 million Homeowners with Negative Equity in Q1 2023
by Calculated Risk on 6/08/2023 08:00:00 AM
From CoreLogic: CoreLogic: US Home Borrowers See First Annual Home Equity Losses Since 2012 in Q1 2023, but Overall Mortgage Performance Remains Strong
CoreLogic® ... today released the Homeowner Equity Report (HER) for the first quarter of 2023. The report shows that U.S. homeowners with mortgages (which account for roughly 63% of all properties) saw home equity decrease by 0.7% year over year, representing a collective loss of $108.4 billion, and an average loss of $5,400 per borrower since the first quarter of 2022.The above graph is from CoreLogic and compares Q1 2023 to Q4 2022 equity distribution by LTV. There are still a few properties with LTV over 125%. But most homeowners have a significant amount of equity.
In the first quarter of 2023, U.S. homeowners with a mortgage lost a small amount of equity year over year for the first time since early 2012, while national combined equity followed suit. As in the fourth quarter of 2022, Western states posted the largest annual home equity losses: Washington (-$74,300), California (-$59,600) and Utah (-$37,700). The equity losses in those states reflect decelerating home prices, with all three posting annual declines in February and March, according to CoreLogic’s Home Price Index.
Despite these declines, home equity remains solid, with the number of underwater properties unchanged since the fourth quarter of 2022. And although some major metro areas saw equity decline on an annual basis, years of rapid appreciation in places like Los Angeles and San Francisco, which have negative equity shares of 0.9%, is keeping homeowners in these metros in good standing.
“Home equity trends closely follow home price changes,” said CoreLogic Chief Economist Selma Hepp. “As a result, while the average amount of equity declined from a year ago, it increased from the fourth quarter of 2022, as monthly home prices growth accelerated in early 2023.”
“The average U.S. homeowner now has more than $274,000 in equity — up significantly from $182,000 before the pandemic,” Hepp continued. “Also, while homeowners in some areas of the country who bought a property last spring have no equity as a result of price losses, forecasted home price appreciation over the next year should help many borrowers regain some of that lost equity.”
Negative equity, also referred to as underwater or upside-down mortgages, applies to borrowers who owe more on their mortgages than their homes are currently worth. As of the first quarter of 2023, the quarterly and annual changes in negative equity were:
Click on graph for larger image.
• Quarterly change: From the fourth quarter of 2022 to the first quarter of 2023, the total number of mortgaged homes in negative equity was unchanged, remaining at 1.2 million homes or 2.1% of all mortgaged properties.
• Annual change: From the first quarter of 2022 to the first quarter of 2023, the total number of homes in negative equity increased by 4% from 1.1 million homes or 2% of all mortgaged properties.
emphasis added

 This is a very different picture than at the start of the housing bust when many homeowners had little equity.
The second graph is from a 2011 CoreLogic report and shows a large number of homeowners with negative equity - even as house prices were nearing a bottom!
On a year-over-year basis, the number of homeowners with negative equity has increased from 1.1 million to 1.2 million.
On a year-over-year basis, the number of homeowners with negative equity has increased from 1.1 million to 1.2 million.
Wednesday, June 07, 2023
Thursday: Unemployment Claims, Flow of Funds
by Calculated Risk on 6/07/2023 09:01:00 PM
 Note: Mortgage rates are from MortgageNewsDaily.com and are for top tier scenarios.
Thursday:
• At 8:30 AM ET, The initial weekly unemployment claims report will be released. The consensus is for 238 thousand initial claims, up from 232 thousand last week.
• At 12:00 PM, Q1 Flow of Funds Accounts of the United States from the Federal Reserve.
Leading Index for Commercial Real Estate Decreased in May
by Calculated Risk on 6/07/2023 03:13:00 PM
From Dodge Data Analytics: Dodge Momentum Index Slides 2% in May Due to Weaker Commercial Planning
The Dodge Momentum Index (DMI), issued by Dodge Construction Network, fell 2.0% in May to 180.5 (2000=100) from the revised April reading of 184.1. Over the month, the commercial component of the DMI fell 6.1%, while the institutional component improved 5.6%.
“The DMI dipped in May amid sustained weakness in commercial planning activity,” stated Sarah Martin, associate director of forecasting for Dodge Construction Network. “Conversely, institutional planning steadily improved over the month as research and development laboratories and hospital projects steadily entered planning. Sustained elevation in the federal funds rate and tighter lending standards will likely constrain growth in the DMI over the second half of 2023; however the index remains above the historical average. This paints an optimistic landscape for non-residential construction in mid-2024, as the economy recovers and the Fed begins to pull back rates.”
Commercial planning in May was negatively impacted by continued weakness in office and hotel planning activity. Institutional planning accelerated alongside steady growth in education, health and amusement projects. Year over year, the DMI remains 11% higher than in May 2022. The commercial and institutional components were up 7% and 18%, respectively.
...
The DMI is a monthly measure of the initial report for nonresidential building projects in planning, shown to lead construction spending for nonresidential buildings by a full year.
emphasis added
 Click on graph for larger image.
This graph shows the Dodge Momentum Index since 2002. The index was at 180.5 in May, down from 184.1 the previous month.
According to Dodge, this index leads "construction spending for nonresidential buildings by a full year". This index suggests a slowdown towards the end of 2023 or in 2024.
Commercial construction is a lagging economic indicator.
Could 6% to 7% 30-Year Mortgage Rates be the "New Normal"?
by Calculated Risk on 6/07/2023 11:52:00 AM
Today, in the Calculated Risk Real Estate Newsletter: Could 6% to 7% 30-Year Mortgage Rates be the "New Normal"?
A brief excerpt:
A key pitch, by real estate agents for home buyers right now, is that they will likely be able to refinance at a lower mortgage rate in a few years. The argument is that once the Federal Reserve has inflation back down to the 2% target, 30-mortgage rates will decline, perhaps to around 5% or lower. Of course, no one expects to see 3% mortgage rates without another crisis.There is much more in the article. You can subscribe at https://calculatedrisk.substack.com/
This graph is from Mortgage News Daily and shows the 30-year mortgage rate since 2010. Rates were mostly in the 3.5% to 5% range for over a decade prior to the pandemic, but it is possible - without a recession or a crisis - that 6% to 7% mortgage rates could be the new normal.


