by Calculated Risk on 6/15/2023 08:34:00 AM
Thursday, June 15, 2023
Weekly Initial Unemployment Claims at 262,000
The DOL reported:
In the week ending June 10, the advance figure for seasonally adjusted initial claims was 262,000, unchanged from the previous week's revised level. The previous week's level was revised up by 1,000 from 261,000 to 262,000. The 4-week moving average was 246,750, an increase of 9,250 from the previous week's revised average. This is the highest level for this average since November 20, 2021 when it was 249,250. The previous week's average was revised up by 250 from 237,250 to 237,500.The following graph shows the 4-week moving average of weekly claims since 1971.
emphasis added
 Click on graph for larger image.
The dashed line on the graph is the current 4-week average. The four-week average of weekly unemployment claims was increased to 246,750.
The previous week was revised up.
Weekly claims were close to the consensus forecast.
Wednesday, June 14, 2023
Thursday: Retail Sales, Unemployment Claims, NY and Philly Fed Mfg, Industrial Production
by Calculated Risk on 6/14/2023 08:39:00 PM

Thursday:
• At 8:30 AM ET, The initial weekly unemployment claims report will be released. The consensus is for 266 thousand initial claims, up from 261 thousand last week.
• Also at 8:30 AM, Retail sales for May is scheduled to be released. The consensus is for a no change in retail sales.
• Also at 8:30 AM, The New York Fed Empire State manufacturing survey for June. The consensus is for a reading of -15.6, up from -31.8.
• Also at 8:30 AM, the Philly Fed manufacturing survey for June. The consensus is for a reading of -12.3, down from -10.4.
• At 9:15 AM, The Fed will release Industrial Production and Capacity Utilization for May. The consensus is for a 0.1% increase in Industrial Production, and for Capacity Utilization to be unchanged at 79.7%.
FOMC Projections and Press Conference
by Calculated Risk on 6/14/2023 02:08:00 PM
Statement here. Hawkish pause with dot plot showing 50bp of additional hikes!
Fed Chair Powell press conference video here or on YouTube here, starting at 2:30 PM ET.
Here are the projections. In March, the FOMC participants’ midpoint of the target level for the federal funds rate was somewhat above 5.125%. The FOMC participants’ midpoint of the target range is now at 5.625%.
| GDP projections of Federal Reserve Governors and Reserve Bank presidents, Change in Real GDP1 | ||||
|---|---|---|---|---|
| Projection Date | 2023 | 2024 | 2025 | |
| June 2023 | 0.7 to 1.2 | 0.9 to 1.5 | 1.6 to 2.0 | |
| March 2023 | 0.0 to 0.8 | 1.0 to 1.5 | 1.7 to 2.1 | |
The unemployment rate was at 3.7% in May. To reach the mid-point of the March FOMC projections for Q4 2023, the economy would likely have to lose over 1 million jobs by Q4. The FOMC revised down their projected unemployment rate for Q4 2023.
| Unemployment projections of Federal Reserve Governors and Reserve Bank presidents, Unemployment Rate2 | ||||
|---|---|---|---|---|
| Projection Date | 2023 | 2024 | 2025 | |
| June 2023 | 4.0 to 4.3 | 4.3 to 4.6 | 4.3 to 4.6 | |
| March 2023 | 4.0 to 4.7 | 4.3 to 4.9 | 4.3 to 4.8 | |
As of April 2023, PCE inflation increased 4.4 percent year-over-year (YoY), up from 4.2 percent YoY in March, and down from the recent peak of 7.0 percent in June 2022. The projection of PCE inflation for Q4 2023 will might be revised up slightly, however May and June 2022 PCE inflation was very high, and YoY PCE inflation will likely decrease sharply over the next two months. The FOMC revised down slightly their PCE inflation projections.
| Inflation projections of Federal Reserve Governors and Reserve Bank presidents, PCE Inflation1 | ||||
|---|---|---|---|---|
| Projection Date | 2023 | 2024 | 2025 | |
| June 2023 | 3.0 to 3.5 | 2.3 to 2.8 | 2.0 to 2.4 | |
| March 2023 | 3.0 to 3.8 | 2.2 to 2.8 | 2.0 to 2.2 | |
PCE core inflation increased 4.7 percent YoY, up from 4.6 percent in March, and down from the recent peak of 5.4 percent in February 2022.; This remains a concern for the FOMC, however this includes shelter that was up 8.4% YoY in April (even though asking rents are mostly unchanged YoY). The FOMC revised up their core PCE projections.
| Core Inflation projections of Federal Reserve Governors and Reserve Bank presidents, Core Inflation1 | ||||
|---|---|---|---|---|
| Projection Date | 2023 | 2024 | 2025 | |
| June 2023 | 3.7 to 4.2 | 2.5 to 3.1 | 2.0 to 2.4 | |
| March 2023 | 3.5 to 3.9 | 2.3 to 2.8 | 2.0 to 2.2 | |
FOMC Statement: Pause
by Calculated Risk on 6/14/2023 02:01:00 PM
Fed Chair Powell press conference video here or on YouTube here, starting at 2:30 PM ET.
FOMC Statement:
Recent indicators suggest that economic activity has continued to expand at a modest pace. Job gains have been robust in recent months, and the unemployment rate has remained low. Inflation remains elevated.
The U.S. banking system is sound and resilient. Tighter credit conditions for households and businesses are likely to weigh on economic activity, hiring, and inflation. The extent of these effects remains uncertain. The Committee remains highly attentive to inflation risks.
The Committee seeks to achieve maximum employment and inflation at the rate of 2 percent over the longer run. In support of these goals, the Committee decided to maintain the target range for the federal funds rate at 5 to 5-1/4 percent. Holding the target range steady at this meeting allows the Committee to assess additional information and its implications for monetary policy. In determining the extent of additional policy firming that may be appropriate to return inflation to 2 percent over time, the Committee will take into account the cumulative tightening of monetary policy, the lags with which monetary policy affects economic activity and inflation, and economic and financial developments. In addition, the Committee will continue reducing its holdings of Treasury securities and agency debt and agency mortgage-backed securities, as described in its previously announced plans. The Committee is strongly committed to returning inflation to its 2 percent objective.
In assessing the appropriate stance of monetary policy, the Committee will continue to monitor the implications of incoming information for the economic outlook. The Committee would be prepared to adjust the stance of monetary policy as appropriate if risks emerge that could impede the attainment of the Committee's goals. The Committee's assessments will take into account a wide range of information, including readings on labor market conditions, inflation pressures and inflation expectations, and financial and international developments.
Voting for the monetary policy action were Jerome H. Powell, Chair; John C. Williams, Vice Chair; Michael S. Barr; Michelle W. Bowman; Lisa D. Cook; Austan D. Goolsbee; Patrick Harker; Philip N. Jefferson; Neel Kashkari; Lorie K. Logan; and Christopher J. Waller.
emphasis added
Update: "Why Year-over-year Headline Inflation will Decline Sharply in May and June"
by Calculated Risk on 6/14/2023 12:17:00 PM
Before the CPI report was released, I wrote: Why Year-over-year Headline Inflation will Decline Sharply in May and June
The key point was that energy and food prices soared in May and June 2022, and as those data points are removed from the year-over-year calculation, the YoY change will decline sharply. However, core inflation does not include food and energy, so we won't see as dramatic a decline in core CPI and core PCE.
I posted this table showing the month-over-month changes that would be removed.

I've added the May CPI numbers, and an estimate from BofA for the May PCE numbers.
Part 2: Current State of the Housing Market; Overview for mid-June
by Calculated Risk on 6/14/2023 09:22:00 AM
Today, in the Calculated Risk Real Estate Newsletter: Part 2: Current State of the Housing Market; Overview for mid-June
A brief excerpt:
Yesterday, in Part 1: Current State of the Housing Market; Overview for mid-June I reviewed home inventory and sales.There is much more in the article. You can subscribe at https://calculatedrisk.substack.com/
...
Most measures of house prices have shown an increase in prices over the last few months, and a key question is off prices will soften again later this year.
Other measures of house prices indicated year-over-year slowing or further declines in April. The NAR reported median prices were down 1.7% YoY in April. Black Knight reported prices were up 1.0% YoY in April, and Freddie Mac reported house prices were up 0.3% YoY in April. Here is a comparison of year-over-year change in the FMHPI, median house prices from the NAR, and the Case-Shiller National index.
The FMHPI and the NAR median prices appear to be leading indicators for Case-Shiller. The median price was down YoY in April, and based on the recent trend, the FMHPI will be negative year-over-year in May - and Case-Shiller will follow within a few months.
In real terms, the Case-Shiller National index is down 4.2% from the peak, seasonally adjusted. Historically it takes a number of years for real prices to return to the previous peak, see House Prices: 7 Years in Purgatory.
MBA: Mortgage Applications Increased in Weekly Survey
by Calculated Risk on 6/14/2023 07:00:00 AM
From the MBA: Mortgage Applications Increase in Latest MBA Weekly Survey
Mortgage applications increased 7.2 percent from one week earlier, according to data from the Mortgage Bankers Association’s (MBA) Weekly Mortgage Applications Survey for the week ending June 9, 2023.
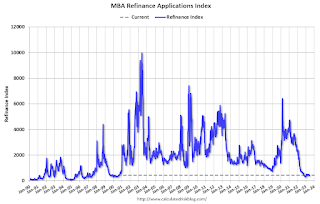
The Market Composite Index, a measure of mortgage loan application volume, increased 7.2 percent on a seasonally adjusted basis from one week earlier. On an unadjusted basis, the Index increased 18 percent compared with the previous week. The Refinance Index increased 6 percent from the previous week and was 41 percent lower than the same week one year ago. The seasonally adjusted Purchase Index increased 8 percent from one week earlier. The unadjusted Purchase Index increased 17 percent compared with the previous week and was 27 percent lower than the same week one year ago.
“Mortgage rates declined for the second straight week, with the 30-year fixed rate decreasing to 6.77 percent. Mortgage applications were up over the week, but remained well below levels from a year ago,” said Joel Kan, MBA’s Vice President and Deputy Chief Economist. “Rates that are still more than a percentage point higher than a year ago, and low for-sale inventory continue to constrain homebuying activity in many markets. The average loan size on a purchase loan decreased for the third straight week, as we continue to see more first-time homebuyer activity in the purchase market.
Added Kan, “Refinance applications accounted for less than a third of all applications and remained more than 40 percent behind last year’s pace. Elevated rates have reduced the benefit of a rate/term refinance for many borrowers and continue to discourage cash-out refinances as borrowers are unwilling to give up their lower rates.”
...
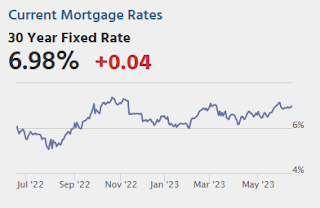
The average contract interest rate for 30-year fixed-rate mortgages with conforming loan balances ($726,200 or less) decreased to 6.77 percent from 6.81 percent, with points decreasing to 0.65 from 0.66 (including the origination fee) for 80 percent loan-to-value ratio (LTV) loans.
emphasis added
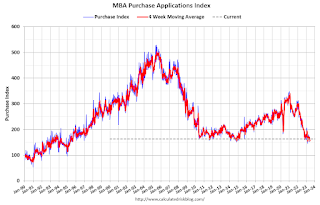
 Click on graph for larger image.
The first graph shows the MBA mortgage purchase index.
According to the MBA, purchase activity is down 27% year-over-year unadjusted.

Tuesday, June 13, 2023
Wednesday: FOMC Statement, PPI
by Calculated Risk on 6/13/2023 08:21:00 PM

Wednesday:
• At 7:00 AM ET, The Mortgage Bankers Association (MBA) will release the results for the mortgage purchase applications index.
• At 8:30 AM, The Producer Price Index for May from the BLS. The consensus is for a 0.2% increase in PPI, and a 0.2% increase in core PPI.
• At 2:00 PM, FOMC Statement. The FOMC is expected to leave the Fed Funds rate unchanged at this meeting.
• At 2:00 PM, FOMC Projections This will include the Federal Open Market Committee (FOMC) participants' projections of the appropriate target federal funds rate along with the quarterly economic projections.
• At 2:30 PM, Fed Chair Jerome Powell holds a press briefing following the FOMC announcement.
Part 1: Current State of the Housing Market; Overview for mid-June
by Calculated Risk on 6/13/2023 12:47:00 PM
Today, in the Calculated Risk Real Estate Newsletter: Part 1: Current State of the Housing Market; Overview for mid-June
A brief excerpt:
Interestingly, new home inventory is essentially at a record percentage of total inventory. This graph uses Not Seasonally Adjusted (NSA) existing home inventory from the National Association of Realtors® (NAR) and new home inventory from the Census Bureau (only completed and under construction inventory).There is much more in the article. You can subscribe at https://calculatedrisk.substack.com/
Note: Mark Fleming, Chief Economist at First American pointed this out in March.
It took a number of years following the housing bust for new home inventory to return to the pre-bubble percent of total inventory. Then, with the pandemic, existing home inventory collapsed and now the percent of new homes is close to 25% of total for sale inventory. The lack of existing home inventory, and few distressed sales, has been a positive for homebuilders.
Cleveland Fed: Median CPI increased 0.4% and Trimmed-mean CPI increased 0.2% in May
by Calculated Risk on 6/13/2023 12:10:00 PM
The Cleveland Fed released the median CPI and the trimmed-mean CPI.
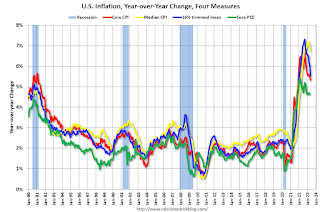
According to the Federal Reserve Bank of Cleveland, the median Consumer Price Index rose 0.4% in May. The 16% trimmed-mean Consumer Price Index increased 0.2% in May. "The median CPI and 16% trimmed-mean CPI are measures of core inflation calculated by the Federal Reserve Bank of Cleveland based on data released in the Bureau of Labor Statistics’ (BLS) monthly CPI report".
 Click on graph for larger image.
This graph shows the year-over-year change for these four key measures of inflation.
Note: The Cleveland Fed released the median CPI details. "Used Cars" increased at a 68% annualized rate in May (this will reverse in June).


