 RSS Feed
 by Calculated Risk on 6/16/2023 09:52:00 AM
Friday, June 16, 2023
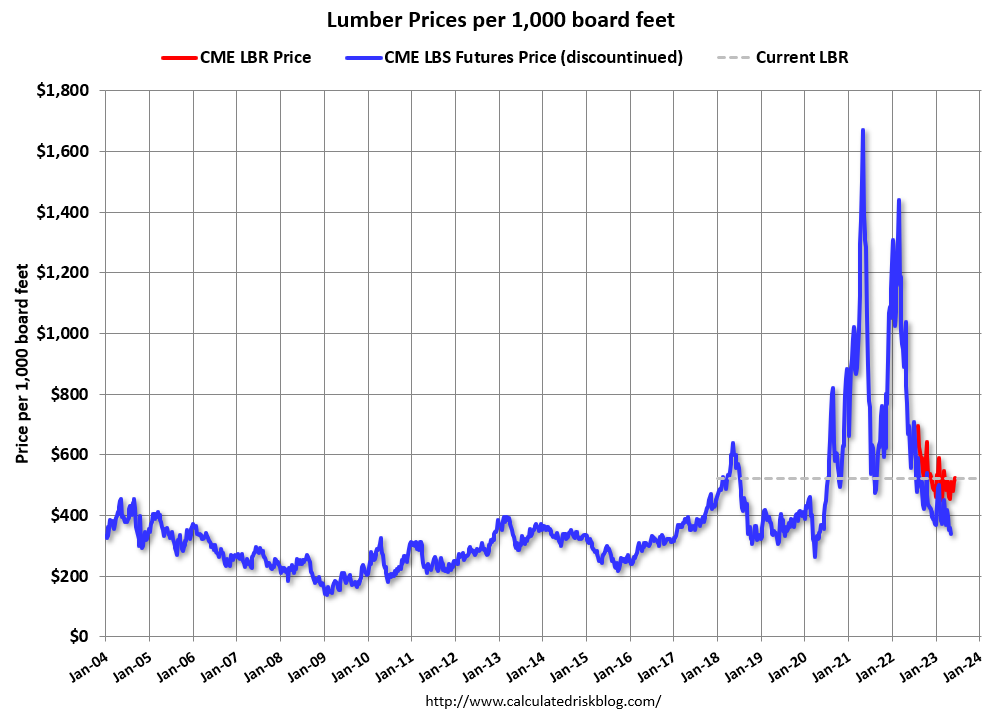
Update: Lumber Prices Down About 25% YoY
SPECIAL NOTE: The CME group discontinued the Random Length Lumber Futures contract on May 16th. I've now switched to a new physically-delivered Lumber Futures contract that was started in August 2022. Unfortunately, this impacts long term price comparisons.
This graph shows CME random length framing futures through May 16th (blue), and the new physically-delivered Lumber Futures (LBR) contract starting in August 2022 (Red).
LBR is currently at $522 per 1000 board feet.
 Click on graph for larger image.
There is somewhat of a seasonal demand for lumber, and lumber prices usually peak in April or May.
We didn't see a significant runup in prices this Spring due to the housing slowdown.
Q2 GDP Tracking: Around 1.5%
by Calculated Risk on 6/16/2023 08:29:00 AM
From BofA:
Today's data left our 2Q US GDP tracking unchanged at 1.3% q/q saar and decreased our 1Q tracker from 2.0% to 1.8%. [June 15th estimate]From Goldman:
emphasis added
[W]e lowered our Q2 GDP tracking estimate by 0.1pp to +1.7% (qoq ar) on the back of softer consumption growth. [June 15th estimate]And from the Altanta Fed: GDPNow
The GDPNow model estimate for real GDP growth (seasonally adjusted annual rate) in the second quarter of 2023 is 1.8 percent on June 15, down from 2.2 percent on June 8. [June 15th estimate]
Thursday, June 15, 2023
Hotels: Occupancy Rate Down 1.6% Year-over-year
by Calculated Risk on 6/15/2023 05:47:00 PM
U.S. hotel performance jumped from the previous week, while year-over-year comparisons were mixed, according to STR‘s latest data through 10 June.The following graph shows the seasonal pattern for the hotel occupancy rate using the four-week average.
4-10 June 2023 (percentage change from comparable week in 2022):
• Occupancy: 69.4% (-1.6%)
• Average daily rate (ADR): US$157.69 (+0.5%)
• Revenue per available room (RevPAR): US$109.38 (-1.2%)
emphasis added
 Click on graph for larger image.
The red line is for 2023, black is 2020, blue is the median, and dashed light blue is for 2022. Dashed purple is for 2018, the record year for hotel occupancy.
The 4-week average of the occupancy rate is at the median rate for the period 2000 through 2022 (Blue).
Note: Y-axis doesn't start at zero to better show the seasonal change.
The 4-week average of the occupancy rate will increase during the summer travel season.
Realtor.com Reports Weekly Active Inventory Up 10% YoY; New Listings Down 22% YoY
by Calculated Risk on 6/15/2023 02:16:00 PM
Realtor.com has monthly and weekly data on the existing home market. Here is their weekly report from economist Jiayi Xu: Weekly Housing Trends View — Data Week Ending June 10th, 2023
• Active inventory growth slowed again, with for-sale homes up just 10% above one year ago. The number of homes for sale continues to grow, but compared to one year ago, the pace is slowing. While today’s shoppers still have many more homes to consider than last year’s shoppers did, worries about high inflation, rising interest rates, and escalating home prices have caused many prospective buyers, especially more first-time buyers, to postpone their plans to purchase a home. This, in turn, has contributed to an increase in the number of homes listed for sale. However, the ongoing decrease in new listings has restrained the growth of active inventory, and there is a possibility of further deceleration in the upcoming weeks.
...
• New listings–a measure of sellers putting homes up for sale–were down again this week, by 22% from one year ago. The number of newly listed homes has been lower than the same time the previous year for the past 49 weeks. As the year-over-year declines fluctuated in the -20% to -26% range, there are no clear signs of sellers re-entering the market at a steady pace. The large decline in new listings is primarily driven by the mortgage “locked-in” as many existing homeowners benefit from mortgage rates that are significantly lower than the current level.
 Here is a graph of the year-over-year change in inventory according to realtor.com.
 Inventory is still up year-over-year - from record lows - however, the YoY increase has slowed sharply recently.
This was the smallest YoY increase since May 2022.
The recent trend suggests active inventory could be down YoY in late June or early July!
Lawler: Update on Mortgage/Treasury Spreads
by Calculated Risk on 6/15/2023 10:55:00 AM
Today, in the Calculated Risk Real Estate Newsletter: Lawler: Update on Mortgage/Treasury Spreads
A brief excerpt:
From housing economist Tom Lawler:There is much more in the article. You can subscribe at https://calculatedrisk.substack.com/
Last May I wrote a two-part piece on why the spread between the 30-year fixed-rate mortgage rate and the 10-year Treasury rate had widened significantly from the end of 2021 to early May of last year, and explained why changes in the yield curve, changes in market-implied interest rate volatility, and the end of the Federal Reserve’s misplaced MBS purchase program all logically and rationally resulted in a widening of the mortgage/10-year Treasury spread. I also said that it was unlikely that mortgage/10-year Treasury spreads were unlikely to revert to what some argue is the “normal” level (there is no such thing) any time soon. Since then, mortgage/10-year Treasury spreads have on average been wider than there were last May, for the most part for logical and rational reasons based on what has happened to the yield curve and implied interest rate volatility. ...
Since mortgage cash flows are very much interest-rate path dependent, the “expected” value of mortgage cash flows across all possible interest-rate paths is heavily dependent on the probability distribution of future interest rates. If market expectations of future interest rate volatility were low, one would expect relatively low mortgage/Treasury spreads, while if market expectation of future interest rate volatility were high, one would expect relatively wide mortgage/Treasury spreads.
The shape of the yield curve also impacts that probability distribution of future interest rates. A very steep yield curve implies a market expectation of increasing future interest rates, and future rate simulations are typically “centered” around this rising “base case” scenario (with possible adjustments for estimated term premia). An inverted yield curve, in contrast, implies a market expectation of declining future interest rates, with future rate simulations centered around this falling “base case” rate scenario. As such, a simulation of future rates with an inverted curve “produces” more rate scenarios where borrowers exercise their prepayment option, implying that mortgage/10-year spreads will be narrower with a steep curve and wider with an inverted curve.
To sum up, one would expect mortgage/10-year spreads to be (1) wider when interest rate volatility is high; and (2) wider when the Treasury yield curve is inverted. And when interest rate volatility is high AND the yield curve is very inverted, one would expect the mortgage/10-year spread to be VERY wide.

Industrial Production Decreased 0.2% in May
by Calculated Risk on 6/15/2023 09:21:00 AM
From the Fed: Industrial Production and Capacity Utilization
Industrial production edged down 0.2 percent in May following two consecutive months of increases. In May, the index for manufacturing ticked up 0.1 percent, while the indexes for mining and utilities fell 0.4 and 1.8 percent, respectively. At 103.0 percent of its 2017 average, total industrial production in May was 0.2 percent above its year-earlier level. Capacity utilization moved down to 79.6 percent in May, a rate that is 0.1 percentage point below its long-run (1972–2022) average.
emphasis added
 Click on graph for larger image.
This graph shows Capacity Utilization. This series is up from the record low set in April 2020, and above the level in February 2020 (pre-pandemic).
Capacity utilization at 79.6% is close to the average from 1972 to 2022. This was slightly below consensus expectations.
Note: y-axis doesn't start at zero to better show the change.
 The second graph shows industrial production since 1967.
Industrial production decreased in May to 103.0. This is above the pre-pandemic level.
Industrial production was below consensus expectations, however previous months were revised up.
Retail Sales Increased 0.3% in May
by Calculated Risk on 6/15/2023 08:44:00 AM
On a monthly basis, retail sales were up 0.3% from April to May (seasonally adjusted), and sales were up 1.6 percent from May 2022.
From the Census Bureau report:
Advance estimates of U.S. retail and food services sales for May 2023, adjusted for seasonal variation and holiday and trading-day differences, but not for price changes, were $686.6 billion, up 0.3 percent from the previous month, and up 1.6 percent above May 2022. ... The March 2023 to April 2023 percent change was unrevised at 0.4 percent.
emphasis added
 Click on graph for larger image.
This graph shows retail sales since 1992. This is monthly retail sales and food service, seasonally adjusted (total and ex-gasoline).
Retail sales ex-gasoline were up 0.6% in May.
The second graph shows the year-over-year change in retail sales and food service (ex-gasoline) since 1993.
Retail and Food service sales, ex-gasoline, increased by 4.1% on a YoY basis.
 The increase in sales in May was close to expectations, however sales in March and April were revised down.
Weekly Initial Unemployment Claims at 262,000
by Calculated Risk on 6/15/2023 08:34:00 AM
The DOL reported:
In the week ending June 10, the advance figure for seasonally adjusted initial claims was 262,000, unchanged from the previous week's revised level. The previous week's level was revised up by 1,000 from 261,000 to 262,000. The 4-week moving average was 246,750, an increase of 9,250 from the previous week's revised average. This is the highest level for this average since November 20, 2021 when it was 249,250. The previous week's average was revised up by 250 from 237,250 to 237,500.The following graph shows the 4-week moving average of weekly claims since 1971.
emphasis added
 Click on graph for larger image.
The dashed line on the graph is the current 4-week average. The four-week average of weekly unemployment claims was increased to 246,750.
The previous week was revised up.
Weekly claims were close to the consensus forecast.
Wednesday, June 14, 2023
Thursday: Retail Sales, Unemployment Claims, NY and Philly Fed Mfg, Industrial Production
by Calculated Risk on 6/14/2023 08:39:00 PM
 Note: Mortgage rates are from MortgageNewsDaily.com and are for top tier scenarios.
Thursday:
• At 8:30 AM ET, The initial weekly unemployment claims report will be released. The consensus is for 266 thousand initial claims, up from 261 thousand last week.
• Also at 8:30 AM, Retail sales for May is scheduled to be released. The consensus is for a no change in retail sales.
• Also at 8:30 AM, The New York Fed Empire State manufacturing survey for June. The consensus is for a reading of -15.6, up from -31.8.
• Also at 8:30 AM, the Philly Fed manufacturing survey for June. The consensus is for a reading of -12.3, down from -10.4.
• At 9:15 AM, The Fed will release Industrial Production and Capacity Utilization for May. The consensus is for a 0.1% increase in Industrial Production, and for Capacity Utilization to be unchanged at 79.7%.
FOMC Projections and Press Conference
by Calculated Risk on 6/14/2023 02:08:00 PM
Statement here. Hawkish pause with dot plot showing 50bp of additional hikes!
Fed Chair Powell press conference video here or on YouTube here, starting at 2:30 PM ET.
Here are the projections. In March, the FOMC participants’ midpoint of the target level for the federal funds rate was somewhat above 5.125%. The FOMC participants’ midpoint of the target range is now at 5.625%.
The BEA reported real GDP increased at a 1.3% annual rate in Q1, and most analysts expect further upward revisions. Tracking estimates suggest Q2 GDP will be in the 1% to 2% range. The FOMC revised up their growth projection for Q4 2023.
| GDP projections of Federal Reserve Governors and Reserve Bank presidents, Change in Real GDP1 | ||||
|---|---|---|---|---|
| Projection Date | 2023 | 2024 | 2025 | |
| June 2023 | 0.7 to 1.2 | 0.9 to 1.5 | 1.6 to 2.0 | |
| March 2023 | 0.0 to 0.8 | 1.0 to 1.5 | 1.7 to 2.1 | |
The unemployment rate was at 3.7% in May. To reach the mid-point of the March FOMC projections for Q4 2023, the economy would likely have to lose over 1 million jobs by Q4. The FOMC revised down their projected unemployment rate for Q4 2023.
| Unemployment projections of Federal Reserve Governors and Reserve Bank presidents, Unemployment Rate2 | ||||
|---|---|---|---|---|
| Projection Date | 2023 | 2024 | 2025 | |
| June 2023 | 4.0 to 4.3 | 4.3 to 4.6 | 4.3 to 4.6 | |
| March 2023 | 4.0 to 4.7 | 4.3 to 4.9 | 4.3 to 4.8 | |
As of April 2023, PCE inflation increased 4.4 percent year-over-year (YoY), up from 4.2 percent YoY in March, and down from the recent peak of 7.0 percent in June 2022. The projection of PCE inflation for Q4 2023 will might be revised up slightly, however May and June 2022 PCE inflation was very high, and YoY PCE inflation will likely decrease sharply over the next two months. The FOMC revised down slightly their PCE inflation projections.
| Inflation projections of Federal Reserve Governors and Reserve Bank presidents, PCE Inflation1 | ||||
|---|---|---|---|---|
| Projection Date | 2023 | 2024 | 2025 | |
| June 2023 | 3.0 to 3.5 | 2.3 to 2.8 | 2.0 to 2.4 | |
| March 2023 | 3.0 to 3.8 | 2.2 to 2.8 | 2.0 to 2.2 | |
PCE core inflation increased 4.7 percent YoY, up from 4.6 percent in March, and down from the recent peak of 5.4 percent in February 2022.; This remains a concern for the FOMC, however this includes shelter that was up 8.4% YoY in April (even though asking rents are mostly unchanged YoY). The FOMC revised up their core PCE projections.
| Core Inflation projections of Federal Reserve Governors and Reserve Bank presidents, Core Inflation1 | ||||
|---|---|---|---|---|
| Projection Date | 2023 | 2024 | 2025 | |
| June 2023 | 3.7 to 4.2 | 2.5 to 3.1 | 2.0 to 2.4 | |
| March 2023 | 3.5 to 3.9 | 2.3 to 2.8 | 2.0 to 2.2 | |


