 RSS Feed
 by Calculated Risk on 6/19/2023 07:06:00 PM
Monday, June 19, 2023
Tuesday: Housing Starts
Weekend:
• Schedule for Week of June 18, 2023
Monday:
• At 8:30 AM ET, Housing Starts for May. The consensus is for 1.405 million SAAR, up from 1.401 million SAAR in April.
From CNBC: Pre-Market Data and Bloomberg futures S&P 500 are down 20 and DOW futures are down 165 (fair value).
Oil prices were up over the last week with WTI futures at $71.29 per barrel and Brent at $76.09 per barrel. A year ago, WTI was at $110, and Brent was at $118 - so WTI oil prices are down about 35% year-over-year.
Here is a graph from Gasbuddy.com for nationwide gasoline prices. Nationally prices are at $3.55 per gallon. A year ago, prices were at $4.97 per gallon, so gasoline prices are down $1.42 per gallon year-over-year.
Some More Good News for Homebuilders
by Calculated Risk on 6/19/2023 01:48:00 PM
Today, in the Calculated Risk Real Estate Newsletter: Some More Good News for Homebuilders
A brief excerpt:
Every housing cycle is different; however, I’ve been arguing that this cycle wouldn’t be anything like the new home market that followed the housing bust, and that this recovery would be more similar to other previous cycles.There is much more in the article. You can subscribe at https://calculatedrisk.substack.com/
...
Here is an updated graph from the previous posts showing new home sales from the Census Bureau for four periods: 1978-1982, 1989 -1993, 2005-2020, and current (red). The prior peak in sales is set to 100 (updated through the April New Home sales release).
Also, it is likely that the Census Bureau is underestimating sales now since cancellation rates are falling! See: New Home Sales and Cancellations for a discussion on how cancellations impact the Census’ sales numbers.

NAHB: Builder Confidence Increased in June
by Calculated Risk on 6/19/2023 10:10:00 AM
The National Association of Home Builders (NAHB) reported the housing market index (HMI) was at 55, up from 50 last month. Any number above 50 indicates that more builders view sales conditions as good than poor.
From the NAHB: Builder Confidence Moves into Positive Territory in June
Solid demand, a lack of existing inventory and improving supply chain efficiency helped shift builder confidence into positive territory for the first time in 11 months.
Builder confidence in the market for newly built single-family homes in June rose five points to 55, according to the National Association of Home Builders (NAHB)/Wells Fargo Housing Market Index (HMI). This marks the sixth straight month that builder confidence has increased and is the first time that sentiment levels have surpassed the midpoint of 50 since July 2022.
A bottom is forming for single-family home building as builder sentiment continues to gradually rise from the beginning of the year. This month marks the first time in a year that both the current and future sales components of the HMI have exceeded 60, as some buyers adjust to a new normal in terms of interest rates. The Federal Reserve nearing the end of its tightening cycle is also good news for future market conditions in terms of mortgage rates and the cost of financing for builder and developer loans. Nonetheless, access for these loans has become more difficult to obtain over the last year, which will ultimately result in lower lot supplies as the industry tries to expand off cycle lows.
...
In another sign of gradual optimism for the state of demand for single-family homes, the June HMI survey shows that overall, builders are gradually pulling back on sales incentives:
• 25% of builders reduced home prices to bolster sales in June. The share was 27% in May and 30% in April. It has declined steadily since peaking at 36% in November 2022.
• The average price reduction was 7% in June, below the 8% rate in December 2022.
• 56% of builders offered incentives to buyers in June, slightly more than in May (54%), but fewer than in December 2022 (62%).
...
All three major HMI indices posted gains in June. The HMI index gauging current sales conditions rose five points to 61, the component charting sales expectations in the next six months increased six points to 62 and the gauge measuring traffic of prospective buyers increased four points to 37.
Looking at the three-month moving averages for regional HMI scores, the Northeast edged up two points to 47, the Midwest increased four points to 43, the South moved three points higher to 55 and the West posted a five-point gain to 46.
emphasis added
 Click on graph for larger image.
This graph shows the NAHB index since Jan 1985.
This was above the consensus forecast.
Housing June 19th Weekly Update: Inventory Increased 1.8% Week-over-week
by Calculated Risk on 6/19/2023 08:21:00 AM
Altos reports that active single-family inventory was up 1.8% week-over-week.
 Click on graph for larger image.
This inventory graph is courtesy of Altos Research.
As of June 16th, inventory was at 451 thousand (7-day average), compared to 443 thousand the prior week.
Year-to-date, inventory is down 81.%. And inventory is up 11.2% from the seasonal bottom nine weeks ago.

The red line is for 2023. The black line is for 2019. Note that inventory is up from the previous two years (the record low was in 2022), but still well below normal levels.
Inventory was up 8.5% compared to the same week in 2022 (last week it was up 11.8%), and down 52.1% compared to the same week in 2019 (last week down 52.4%).
It appears likely inventory will be down year-over-year in late June or early July.
Mike Simonsen discusses this data regularly on Youtube.
Sunday, June 18, 2023
LA Port Inbound Traffic Down Sharply YoY in May
by Calculated Risk on 6/18/2023 08:55:00 AM
Notes: The expansion to the Panama Canal was completed in 2016 (As I noted several years ago), and some of the traffic that used the ports of Los Angeles and Long Beach is probably going through the canal. This might be impacting TEUs on the West Coast.
Container traffic gives us an idea about the volume of goods being exported and imported - and usually some hints about the trade report since LA area ports handle about 40% of the nation's container port traffic.
The following graphs are for inbound and outbound traffic at the ports of Los Angeles and Long Beach in TEUs (TEUs: 20-foot equivalent units or 20-foot-long cargo container).
To remove the strong seasonal component for inbound traffic, the first graph shows the rolling 12-month average.
 Click on graph for larger image.
On a rolling 12-month basis, inbound traffic decreased 2.0% in May compared to the rolling 12 months ending in April. Outbound traffic decreased 0.6% compared to the rolling 12 months ending the previous month.
The 2nd graph is the monthly data (with a strong seasonal pattern for imports).
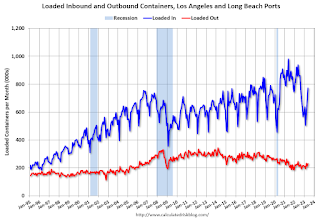 Usually imports peak in the July to October period as retailers import goods for the Christmas holiday, and then decline sharply and bottom in February or March depending on the timing of the Chinese New Year.
 Usually imports peak in the July to October period as retailers import goods for the Christmas holiday, and then decline sharply and bottom in February or March depending on the timing of the Chinese New Year.
Imports were down 18% YoY in May, and exports were down 6% YoY. The volume of containers unloaded last year was much stronger because of all the ships waiting to unload.
It is possible that exports have bottomed after declining for several years (even prior to the pandemic).
Saturday, June 17, 2023
Real Estate Newsletter Articles this Week: Current State of the Housing Market
by Calculated Risk on 6/17/2023 02:11:00 PM
At the Calculated Risk Real Estate Newsletter this week:
• Lawler: Early Read on Existing Home Sales in May
• 3rd Look at Local Housing Markets in May
• Lawler: Update on Mortgage/Treasury Spreads
• Part 2: Current State of the Housing Market; Overview for mid-June
• Part 1: Current State of the Housing Market; Overview for mid-June
• 2nd Look at Local Housing Markets in May
This is usually published 4 to 6 times a week and provides more in-depth analysis of the housing market.
You can subscribe at https://calculatedrisk.substack.com/
Most content is available for free (and no Ads), but please subscribe!
Schedule for Week of June 18, 2023
by Calculated Risk on 6/17/2023 08:11:00 AM
The key reports this week are May Housing Starts and Existing Home Sales.
Fed Chair Powell provides the Semiannual Monetary Policy Report to Congress on Wednesday and Thursday.
All US markets will be closed in observance of Juneteenth National Independence Day
10:00 AM: The June NAHB homebuilder survey. The consensus is for a reading of 51, up from 50 last month. Any number above 50 indicates that more builders view sales conditions as good than poor.
 8:30 AM ET: Housing Starts for May.
 This graph shows single and total housing starts since 1968.
The consensus is for 1.405 million SAAR, up from 1.401 million SAAR in April.
7:00 AM ET: The Mortgage Bankers Association (MBA) will release the results for the mortgage purchase applications index.
10:00 AM: Testimony, Fed Chair Jerome Powell, Semiannual Monetary Policy Report to Congress, Before the U.S. House Financial Services Committee
During the day: The AIA's Architecture Billings Index for May (a leading indicator for commercial real estate).
8:30 AM: The initial weekly unemployment claims report will be released. The consensus is for 266 thousand initial claims, up from 262 thousand last week.
8:30 AM ET: Chicago Fed National Activity Index for May. This is a composite index of other data.
 10:00 AM: Existing Home Sales for May from the National Association of Realtors (NAR). The consensus is for 4.24 million SAAR, down from 4.28 million.
The graph shows existing home sales from 1994 through the report last month.
Housing economist Tom Lawler expects the NAR to report sales of 4.25 million SAAR for May.
10:00 AM: Testimony, Fed Chair Jerome Powell, Semiannual Monetary Policy Report to Congress, Before the U.S. Senate Committee on Banking, Housing, and Urban Affairs
11:00 AM: the Kansas City Fed manufacturing survey for June.
No major economic releases scheduled.
Friday, June 16, 2023
June 16th COVID Update: New Pandemic Lows for Deaths and Hospitalizations
by Calculated Risk on 6/16/2023 09:17:00 PM
 Note: Mortgage rates are from MortgageNewsDaily.com and are for top tier scenarios.
Due to changes at the CDC, weekly cases are no longer updated.
After the first few weeks, the pandemic low for weekly deaths had been the week of July 7, 2021, at 1,690 deaths (until recently).
For COVID hospitalizations, the previous low was 9,821 (until recently).
| COVID Metrics | ||||
|---|---|---|---|---|
| Now | Week Ago | Goal | ||
| Hospitalized2 | 6,133 | 6,642 | ≤3,0001 | |
| Deaths per Week2 | 588 | 682 | ≤3501 | |
| 1my goals to stop weekly posts, 2Weekly for Currently Hospitalized, and Deaths 🚩 Increasing number weekly for Hospitalized and Deaths ✅ Goal met. | ||||
 Click on graph for larger image.
This graph shows the weekly (columns) number of deaths reported.
For deaths, I'm currently using 3 weeks ago for "now", since the most recent two weeks will be revised significantly.
Lawler: Early Read on Existing Home Sales in May
by Calculated Risk on 6/16/2023 05:35:00 PM
From housing economist Tom Lawler:
Based on publicly-available local realtor/MLS reports released across the country through today, comprising over 225,000 transactions, I project that existing home sales as estimated by the National Association of Realtors ran at a seasonally adjusted annual rate of 4.25 million in May, down 0.7% from April’s preliminary pace and down 21.3% from last May’s seasonally adjusted pace. Unadjusted sales should show a smaller YOY % decline, reflecting this May’s higher business day count relative to last May’s.
Local realtor/MLS reports suggest that the median existing single-family home sales price last month was down by about 0.5% from last May.
3rd Look at Local Housing Markets in May
by Calculated Risk on 6/16/2023 03:27:00 PM
Today, in the Calculated Risk Real Estate Newsletter: 3rd Look at Local Housing Markets in May
A brief excerpt:
This is the third look at local markets in May. I’m tracking about 40 local housing markets in the US. Some of the 40 markets are states, and some are metropolitan areas. I’ll update these tables throughout the month as additional data is released.There is much more in the article. You can subscribe at https://calculatedrisk.substack.com/
Closed sales in May were mostly for contracts signed in March and April. Since 30-year fixed mortgage rates were in the 6% to 6.5% range in March and April - compared to the 4% to 5% range the previous year - closed sales were down significantly year-over-year in May.
...
In May, sales in these markets were down 16.3%. In April, these same markets were down 24.9% YoY Not Seasonally Adjusted (NSA).
This is a smaller YoY decline NSA than in April for these markets, however seasonally adjusted, it is closer. Another factor in the smaller YoY decline was that sales were steadily declining last year due to higher mortgage rates.
This data suggests the May existing home sales report will show another significant YoY decline and the 21st consecutive month with a YoY decline in sales.
More local markets to come!


