by Calculated Risk on 6/22/2023 02:01:00 PM
Thursday, June 22, 2023
Hotels: Occupancy Rate Down 1.1% Year-over-year
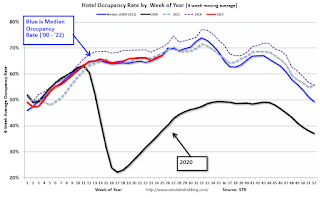
U.S. hotel performance increased from the previous week, but year-over-year comparisons were mixed, according to STR‘s latest data through 17 June.The following graph shows the seasonal pattern for the hotel occupancy rate using the four-week average.
11-17 June 2023 (percentage change from comparable week in 2022):
• Occupancy: 70.8% (-1.1%)
• Average daily rate (ADR): US$159.82 (+2.6%)
• Revenue per available room (RevPAR): US$113.17 (+1.5%)
emphasis added
 Click on graph for larger image.
The red line is for 2023, black is 2020, blue is the median, and dashed light blue is for 2022. Dashed purple is for 2018, the record year for hotel occupancy.
NAR: Existing-Home Sales Increased to 4.30 million SAAR in May; Median Prices Declined 3.1% YoY
by Calculated Risk on 6/22/2023 10:41:00 AM
Today, in the CalculatedRisk Real Estate Newsletter: NAR: Existing-Home Sales Increased to 4.30 million SAAR in May; Median Prices Declined 3.1% YoY
Excerpt:
On prices, the NAR reported:There is much more in the article. You can subscribe at https://calculatedrisk.substack.com/ Please subscribe!The median existing-home price for all housing types in May was $396,100, a decline of 3.1% from May 2022 ($408,600). Prices grew in the Northeast and Midwest but fell in the South and West.Median prices are distorted by the mix (repeat sales indexes like Case-Shiller and FHFA are probably better for measuring prices).
The YoY change in the median price peaked at 25.2% in May 2021 and prices are now down 3.1% YoY. Median house prices increased 2.6% from April to May and are down 4.3% from the peak in June 2022 (NSA). It is likely the Case-Shiller index will be down soon year-over-year.
Note that closed sales in May were mostly for contracts signed in March and April. Mortgage rates, according to the Freddie Mac PMMS, average around 6.4% in March and April. June sales will be for contracts signed in April and May, when mortgage rates also averaged around 6.4%, so closed sales will likely be similar in June compared to May.
NAR: Existing-Home Sales Increased to 4.30 million SAAR in May
by Calculated Risk on 6/22/2023 10:11:00 AM
From the NAR: Existing-Home Sales Edged Higher by 0.2% in May
Existing-home sales marginally increased in May, according to the National Association of REALTORS®. Sales were mixed among the four major U.S. regions, with the South and West posting improvements and the Northeast and Midwest experiencing pullbacks. All four regions experienced year-over-year sales declines.
Total existing-home sales – completed transactions that include single-family homes, townhomes, condominiums and co-ops – rose 0.2% from April to a seasonally adjusted annual rate of 4.30 million in May. Year-over-year, sales dropped 20.4% (down from 5.40 million in May 2022).
...
Total housing inventory registered at the end of May was 1.08 million units, up 3.8% from April but down 6.1% from one year ago (1.15 million). Unsold inventory sits at a 3.0-month supply at the current sales pace, up from 2.9 months in April and 2.6 months in May 2022.
emphasis added
 Click on graph for larger image.
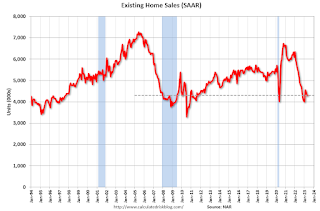
This graph shows existing home sales, on a Seasonally Adjusted Annual Rate (SAAR) basis since 1994.
Sales in May (4.30 million SAAR) were up 0.2% from the previous month and were 20.4% below the May 2022 sales rate.
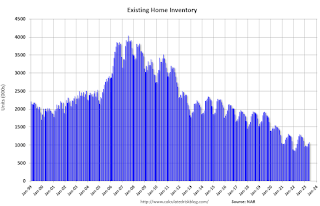 According to the NAR, inventory increased to 1.08 million in May from 1.04 million in April.
The last graph shows the year-over-year (YoY) change in reported existing home inventory and months-of-supply. Since inventory is not seasonally adjusted, it really helps to look at the YoY change. Note: Months-of-supply is based on the seasonally adjusted sales and not seasonally adjusted inventory.
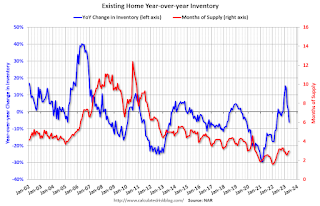 Inventory was down 6.1% year-over-year (blue) in May compared to May 2022.
 Months of supply (red) increased to 3.0 months in May from 2.9 months in April.
This was slightly above the consensus forecast. I'll have more later.
Weekly Initial Unemployment Claims at 264,000
by Calculated Risk on 6/22/2023 08:34:00 AM
The DOL reported:
In the week ending June 17, the advance figure for seasonally adjusted initial claims was 264,000, unchanged from the previous week's revised level. The previous week's level was revised up by 2,000 from 262,000 to 264,000. The 4-week moving average was 255,750, an increase of 8,500 from the previous week's revised average. This is the highest level for this average since November 13, 2021 when it was 260,000. The previous week's average was revised up by 500 from 246,750 to 247,250.The following graph shows the 4-week moving average of weekly claims since 1971.
emphasis added
 Click on graph for larger image.
The dashed line on the graph is the current 4-week average. The four-week average of weekly unemployment claims increased to 255,750.
The previous week was revised up.
Weekly claims were close to the consensus forecast.
Wednesday, June 21, 2023
Thursday: Unemployment Claims, Existing Home Sales, Fed Chair Powell
by Calculated Risk on 6/21/2023 08:44:00 PM
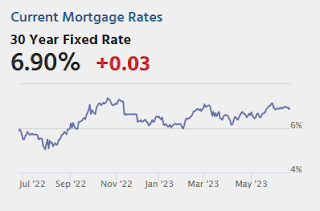
Thursday:
• At 8:30 AM ET, The initial weekly unemployment claims report will be released. The consensus is for 266 thousand initial claims, up from 262 thousand last week.
• Also at 8:30 AM, Chicago Fed National Activity Index for May. This is a composite index of other data.
• At 10:00 AM, Existing Home Sales for May from the National Association of Realtors (NAR). The consensus is for 4.24 million SAAR, down from 4.28 million.
• Also at 10:00 AM, Testimony, Fed Chair Jerome Powell, Semiannual Monetary Policy Report to Congress, Before the U.S. Senate Committee on Banking, Housing, and Urban Affairs
• At 11:00 AM, the Kansas City Fed manufacturing survey for June.
AIA: Architecture Billings "Rebound" in May; Multi-family Billings Decline for 11th Consecutive Month
by Calculated Risk on 6/21/2023 12:13:00 PM
Note: This index is a leading indicator primarily for new Commercial Real Estate (CRE) investment.
From the AIA: AAIA/Deltek Architecture Billings Index Indicates Rebound in May Business Conditions
Architecture firms experienced a rebound in billings in May after a downturn in April, according to the latest Architecture Billings Index (ABI) from the American Institute of Architects (AIA) and Deltek. The index score for May was the highest it has been since September 2022. Inquiries into new projects and design contracts also increased this month, reaching their highest levels since February.
The billings score for April increased from 48.5 in April to 51.0 in May (any score above 50 indicates an increase in firm billings). Firms also reported that inquiries into new projects accelerated to 57.2 from 53.9 the previous month. Further, the value of new design contracts also moved up to 52.3 in May from 49.8 in April.
“The modest improvement in overall demand for architectural services that we saw last month is encouraging news", said AIA Chief Economist Kermit Baker Hon. AIA, Ph.D., “However, there continues to be variation in the performance of firms by regional location and building specialization. This suggests that overall business conditions for the profession likely will continue to be variable."
Despite growth in the overall ABI this month, business conditions remain variable in different regions of the country. Billings improved at firms located in the South for the second consecutive month in May, while they were essentially flat at firms located in the Midwest, following six months of growth. However, billings continued to decline at firms located in both the West and Northeast, where scores have been below 50 since last fall.
By firm specialization, business conditions softened further at firms with a multifamily residential specialization in May, falling to the lowest level in two years. Billings also declined for the ninth consecutive month at firms with a commercial/industrial specialization. On the other hand, business conditions improved for the second month in a row at firms with an institutional specialization, as they reported their strongest growth since last year.
...
• Regional averages: South (52.3); Midwest (49.6); Northeast (48.7); West (47.7)
• Sector index breakdown: institutional (53.4); mixed practice (firms that do not have at least half of their billings in any one other category) (52.7); commercial/industrial (47.5); multi-family residential (43.0)
emphasis added
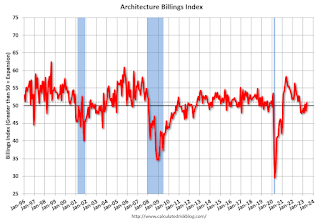 Click on graph for larger image.
This graph shows the Architecture Billings Index since 1996. The index was at 51.0 in May, up from 48.5 in April. Anything above 50 indicates an increase in demand for architects' services.
Note: This includes commercial and industrial facilities like hotels and office buildings, multi-family residential, as well as schools, hospitals and other institutions.
This index has declined in 6 of the last 8 months. This index usually leads CRE investment by 9 to 12 months, so this index suggests a slowdown in CRE investment later in 2023 and into 2024.
California Home Sales Down 23.6% YoY in May, Median Prices Decline 6.4% YoY
by Calculated Risk on 6/21/2023 10:31:00 AM
Today, in the CalculatedRisk Real Estate Newsletter: California Home Sales Down 23.6% YoY in May, Median Prices Decline 6.4% YoY
Excerpt:
California doesn’t report monthly inventory numbers, but they do report sales and the change in months of inventory.There is more in the post. You can subscribe at https://calculatedrisk.substack.com/
Note: The National Association of Realtors (NAR) is scheduled to release May existing home sales tomorrow, Thursday, June 22, 2023, at 10:00 AM ET. The consensus is for 4.24 million SAAR.
Last Friday, housing economist Tom Lawler noted:Based on publicly-available local realtor/MLS reports released across the country through today, comprising over 225,000 transactions, I project that existing home sales as estimated by the National Association of Realtors ran at a seasonally adjusted annual rate of 4.25 million in May, down 0.7% from April’s preliminary pace and down 21.3% from last May’s seasonally adjusted pace.Here is the press release from the California Association of Realtors® (C.A.R.): Interest rate reprieve boosts California home sales to highest level in eight months, C.A.R. reports• Existing, single-family home sales totaled 289,460 in May on a seasonally adjusted annualized rate, up 9.8 percent from April and down 23.6 percent from May 2022.
• May’s statewide median home price was $836,110, up 3.0 percent from April and down 6.4 percent from May 2022.
Fed Chair Powell: Semiannual Monetary Policy Report to the Congress
by Calculated Risk on 6/21/2023 08:42:00 AM
This testimony will be live here at 10:00 AM ET.
Report here.
From Fed Chair Powell: Semiannual Monetary Policy Report to the Congress. An excerpt on inflation:
We at the Fed remain squarely focused on our dual mandate to promote maximum employment and stable prices for the American people. My colleagues and I understand the hardship that high inflation is causing, and we remain strongly committed to bringing inflation back down to our 2 percent goal. Price stability is the responsibility of the Federal Reserve, and without it, the economy does not work for anyone. In particular, without price stability, we will not achieve a sustained period of strong labor market conditions that benefit all.
...
In light of how far we have come in tightening policy, the uncertain lags with which monetary policy affects the economy, and potential headwinds from credit tightening, the FOMC decided last week to maintain the target range for the federal funds rate at 5 to 5-1/4 percent and to continue the process of significantly reducing our securities holdings. Nearly all FOMC participants expect that it will be appropriate to raise interest rates somewhat further by the end of the year. But at last week's meeting, considering how far and how fast we have moved, we judged it prudent to hold the target range steady to allow the Committee to assess additional information and its implications for monetary policy. In determining the extent of additional policy firming that may be appropriate to return inflation to 2 percent over time, we will take into account the cumulative tightening of monetary policy, the lags with which monetary policy affects economic activity and inflation, and economic and financial developments. We will continue to make our decisions meeting by meeting, based on the totality of incoming data and their implications for the outlook for economic activity and inflation, as well as the balance of risks.
We remain committed to bringing inflation back down to our 2 percent goal and to keeping longer-term inflation expectations well anchored. Reducing inflation is likely to require a period of below-trend growth and some softening of labor market conditions. Restoring price stability is essential to set the stage for achieving maximum employment and stable prices over the longer run.
emphasis added
MBA: Mortgage Applications Increased in Weekly Survey
by Calculated Risk on 6/21/2023 07:00:00 AM
From the MBA: Mortgage Applications Increase in Latest MBA Weekly Survey
Mortgage applications increased 0.5 percent from one week earlier, according to data from the Mortgage Bankers Association’s (MBA) Weekly Mortgage Applications Survey for the week ending June 16, 2023.
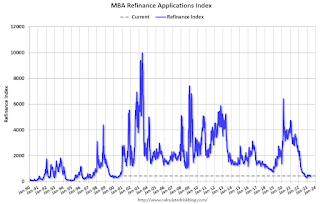
The Market Composite Index, a measure of mortgage loan application volume, increased 0.5 percent on a seasonally adjusted basis from one week earlier. On an unadjusted basis, the Index decreased 1 percent compared with the previous week. The Refinance Index decreased 2 percent from the previous week and was 40 percent lower than the same week one year ago. The seasonally adjusted Purchase Index increased 2 percent from one week earlier. The unadjusted Purchase Index decreased 0.1 percent compared with the previous week and was 32 percent lower than the same week one year ago.
“The 30-year fixed mortgage rate declined for the third consecutive week to 6.73 percent, while other mortgage rates saw mixed results. Purchase applications increased, driven by a 2 percent gain in conventional purchase applications and a 3 percent increase in FHA purchase activity,” said Joel Kan, MBA’s Vice President and Deputy Chief Economist. “First-time homebuyers account for a large share of FHA purchase loans, and this increase is a sign that while buyer interest is there, activity continues to be constrained by low levels of affordable inventory. Refinance applications continued their decline after the previous week’s increase, with the refinance share of applications just below 27 percent.”
Added Kan, “The rate for jumbo loans exceeded the conforming rate for the second straight week – the last time jumbo rates were higher was in December 2021.Tighter liquidity conditions have prompted jumbo lenders to pull back, increasing rates in the process.
...
The average contract interest rate for 30-year fixed-rate mortgages with conforming loan balances ($726,200 or less) decreased to 6.73 percent from 6.77 percent, with points decreasing to 0.64 from 0.65 (including the origination fee) for 80 percent loan-to-value ratio (LTV) loans.
emphasis added
 Click on graph for larger image.
The first graph shows the MBA mortgage purchase index.
According to the MBA, purchase activity is down 32% year-over-year unadjusted.
Tuesday, June 20, 2023
Wednesday: Fed Chair Powell Semiannual Monetary Policy Report to Congress
by Calculated Risk on 6/20/2023 07:54:00 PM
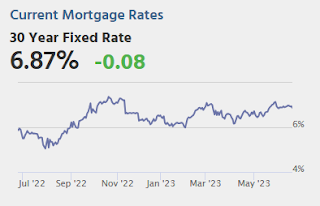
Wednesday:
• At 7:00 AM ET, The Mortgage Bankers Association (MBA) will release the results for the mortgage purchase applications index.
• At 10:00 AM, Testimony, Fed Chair Jerome Powell, Semiannual Monetary Policy Report to Congress, Before the U.S. House Financial Services Committee
• During the day, The AIA's Architecture Billings Index for May (a leading indicator for commercial real estate).


