 RSS Feed
 by Calculated Risk on 6/23/2023 08:01:00 PM
Friday, June 23, 2023
June 23rd COVID Update: New Pandemic Lows for Deaths and Hospitalizations
 Note: Mortgage rates are from MortgageNewsDaily.com and are for top tier scenarios.
Due to changes at the CDC, weekly cases are no longer updated.
After the first few weeks, the pandemic low for weekly deaths had been the week of July 7, 2021, at 1,690 deaths (until recently).
For COVID hospitalizations, the previous low was 9,821 (until recently).
| COVID Metrics | ||||
|---|---|---|---|---|
| Now | Week Ago | Goal | ||
| Hospitalized2 | 6,133 | 6,642 | ≤3,0001 | |
| Deaths per Week2 | 653 | 709 | ≤3501 | |
| 1my goals to stop weekly posts, 2Weekly for Currently Hospitalized, and Deaths 🚩 Increasing number weekly for Hospitalized and Deaths ✅ Goal met. | ||||
 Click on graph for larger image.
This graph shows the weekly (columns) number of deaths reported.
For deaths, I'm currently using 3 weeks ago for "now", since the most recent two weeks will be revised significantly.
On Hospitalizations (table data above is from last week):
"COVID-19 hospitalization data will not be updated during the week of June 19, 2023, due to a change in required reporting cadence from daily to weekly, following the expiration of the federal Public Health Emergency (PHE) declaration. COVID-19 hospitalization data will be updated each Monday beginning June 26, 2023."
Philly Fed: State Coincident Indexes Increased in all 50 States in May (3-Month Basis)
by Calculated Risk on 6/23/2023 04:25:00 PM
From the Philly Fed:
The Federal Reserve Bank of Philadelphia has released the coincident indexes for the 50 states for May 2023. Over the past three months, the indexes increased in all 50 states, for a three-month diffusion index of 100. Additionally, in the past month, the indexes increased in 47 states, decreased in one state, and remained stable in two, for a one-month diffusion index of 92. For comparison purposes, the Philadelphia Fed has also developed a similar coincident index for the entire United States. The Philadelphia Fed’s U.S. index increased 0.8 percent over the past three months and 0.1 percent in May.Note: These are coincident indexes constructed from state employment data. An explanation from the Philly Fed:
emphasis added
The coincident indexes combine four state-level indicators to summarize current economic conditions in a single statistic. The four state-level variables in each coincident index are nonfarm payroll employment, average hours worked in manufacturing by production workers, the unemployment rate, and wage and salary disbursements deflated by the consumer price index (U.S. city average). The trend for each state’s index is set to the trend of its gross domestic product (GDP), so long-term growth in the state’s index matches long-term growth in its GDP.
 Click on map for larger image.
Here is a map of the three-month change in the Philly Fed state coincident indicators. This map was all red during the worst of the Pandemic and also at the worst of the Great Recession.
The map is all positive on a three-month basis.
Source: Philly Fed.
 And here is a graph is of the number of states with one month increasing activity according to the Philly Fed.
 This graph includes states with minor increases (the Philly Fed lists as unchanged).
In May, 47 states had increasing activity including minor increases.
In May, 47 states had increasing activity including minor increases.
Q2 GDP Tracking: Around 1.5%
by Calculated Risk on 6/23/2023 01:01:00 PM
From BofA:
Overall, data since our last weekly publication moved up our 2Q GDP tracking estimate from 1.3% q/q saar to 1.4% and our 1Q GDP tracking remained at 1.8% q/q saar. [June 23rd estimate]From Goldman:
emphasis added
[W]e left our Q2 GDP tracking estimate unchanged at +1.8% (qoq ar). [June 22nd estimate]And from the Altanta Fed: GDPNow
The GDPNow model estimate for real GDP growth (seasonally adjusted annual rate) in the second quarter of 2023 is 1.9 percent on June 20, up from 1.8 percent on June 15. [June 20th estimate]
Final Look at Local Housing Markets in May
by Calculated Risk on 6/23/2023 09:52:00 AM
Today, in the Calculated Risk Real Estate Newsletter: Final Look at Local Housing Markets in May
A brief excerpt:
Each month I track closed sales, new listings and active inventory in a sample of local markets around the country (over 40 local housing markets) in the US to get an early sense of changes in the housing market. In addition, we can look for regional differences. For example, listings in Texas and Florida are up more than in most other areas, and sales are down less year-over-year.There is much more in the article. You can subscribe at https://calculatedrisk.substack.com/
...
And a table of May sales.
In May, sales in these markets were down 17.4%. In April, these same markets were down 26.1% YoY Not Seasonally Adjusted (NSA).
My early expectation is we will see a somewhat similar level of sales in June on a seasonally adjusted annual rate basis (SAAR) as in May. 30-year mortgage rates averaged about 6.4% in March and April (for closed sales in May), and 30-year rates averaged close to 6.4% in April and May.
On a Not Seasonally Adjusted (NSA) basis, June is usually the strongest month of the calendar year for closed sales, followed by July and August.
...
More local data coming in July for activity in June!

Black Knight: "Past-Due Mortgages Approach Recent Record Lows" in May
by Calculated Risk on 6/23/2023 08:21:00 AM
From Black Knight: Black Knight: Past-Due Mortgages Approach Recent Record Lows as Serious Delinquencies Continue Improvement; Prepayments See Seasonal Rise
• Reversing much of April’s calendar-driven spike, the national delinquency rate fell 11 basis points (bps) in May to hit 3.10% – the lowest it’s been other than March 2023’s record of 2.92%According to Black Knight's First Look report, the percent of loans delinquent decreased 6% in May compared to April and decreased 3% year-over-year.
• The number of borrowers a single payment past due improved by 94K (-9.5%), erasing nearly half of the prior month’s increase
• Serious delinquencies (loans 90 or more days past due) continued to improve nationally – falling by 18K (-3.7%) from April, putting this loan population down more than 200K (nearly 30%) since May 2022
• Though foreclosure starts increased to 25.4K for the month (+2.2%), they remain near April’s 6-month low and 41% below the same period in 2019, the last comparable May before the pandemic
• Foreclosure actions were started on 5.1% of serious delinquencies in May, up only marginally from April and still more than a full percentage point below the March 2020 rate at the start of the pandemic
• The number of loans in active foreclosure improved by 4K during the month and is now down 41K (-15%) from March 2020, with foreclosure sales (completions) rising 5.5% from April to 6.8K
• Prepayment activity rose to a 0.54% single-month mortality (SMM) rate – the highest level seen since September 2022, despite interest rates in the 6.7% range – but is still down 40% from May 2022
emphasis added
Black Knight reported the U.S. mortgage delinquency rate (loans 30 or more days past due, but not in foreclosure) was 3.10% in May, down from 3.31% the previous month.
The percent of loans in the foreclosure process decreased in May to 0.43%, from 0.44% the previous month.
The number of delinquent properties, but not in foreclosure, is down 20,000 properties year-over-year, and the number of properties in the foreclosure process is up 8,000 properties year-over-year.
| Black Knight: Percent Loans Delinquent and in Foreclosure Process | ||||
|---|---|---|---|---|
| May 2023 | Apr 2023 | |||
| Delinquent | 3.10% | 3.31% | ||
| In Foreclosure | 0.43% | 0.44% | ||
| Number of properties: | ||||
| Number of properties that are delinquent, but not in foreclosure: | 1,639,000 | 1,746,000 | ||
| Number of properties in foreclosure pre-sale inventory: | 234,000 | 229,000 | ||
| Total Properties | 1,868,000 | 1,980,000 | ||
Thursday, June 22, 2023
June Vehicle Sales Forecast: 15.9 million SAAR, Up Sharply YoY
by Calculated Risk on 6/22/2023 06:45:00 PM
From WardsAuto: June U.S. Light-Vehicle Sales Pegged for 21% Gain; Q2 to Roll in at 2-Year-High 15.7 Million SAAR (pay content). Brief excerpt:
Deliveries in the second quarter will total 4.1 million units, 18% above like-2022, and stronger than Q1’s 8% gain. First-half 2023 volume will total 7.67 million units, up 13% from January-June 2022’s 6.78 million.
emphasis added
 Click on graph for larger image.
This graph shows actual sales from the BEA (Blue), and Wards forecast for June (Red).
The Wards forecast of 15.9 million SAAR, would be up 5.7% from last month, and up 21.9% from a year ago.
Vehicle sales are usually a transmission mechanism for Federal Open Market Committee (FOMC) policy, although far behind housing. This time vehicle sales were more suppressed by supply chain issues and have picked up recently.
Realtor.com Reports Weekly Active Inventory Up 5% YoY; New Listings Down 26% YoY
by Calculated Risk on 6/22/2023 03:31:00 PM
Realtor.com has monthly and weekly data on the existing home market. Here is their weekly report from economist Danielle Hale: Weekly Housing Trends View — Data Week Ending June 17, 2023
• Active inventory growth slowed again, with for-sale homes up just 5% above one year ago. The number of homes for sale continues to grow, but the advantage over one year ago is shrinking and likely to slow in the months ahead. As mortgage rates surged in 2022, both buyers and sellers adjusted plans and expectations, and the number of for-sale homes on the market climbed sharply. As we lap the biggest increases in inventory last year, lower interest from homeowners in selling today is eating into the total number of options for buyers, especially with existing home sales largely steadying. This is a contributor to the big shift in expectations we have for inventory in 2023, which will likely decline for the year as a whole.
• New listings–a measure of sellers putting homes up for sale–were down again this week, by 26% from one year ago. The number of newly listed homes has been lower than the same time the previous year for the past 50 weeks. Despite an uptick in seller confidence in May, with an increasing share of consumers saying now is a good time to sell, a smaller number of homeowners are choosing to list homes for sale, limiting the number of cumulative options that home shoppers are likely to see over the course of their search.
 Here is a graph of the year-over-year change in inventory according to realtor.com.
 Inventory is still up year-over-year - from record lows - however, the YoY increase has slowed sharply recently.
This was the smallest YoY increase since May 2022.
The recent trend suggests active inventory will likely be down YoY in the next couple of weeks!
Hotels: Occupancy Rate Down 1.1% Year-over-year
by Calculated Risk on 6/22/2023 02:01:00 PM
U.S. hotel performance increased from the previous week, but year-over-year comparisons were mixed, according to STR‘s latest data through 17 June.The following graph shows the seasonal pattern for the hotel occupancy rate using the four-week average.
11-17 June 2023 (percentage change from comparable week in 2022):
• Occupancy: 70.8% (-1.1%)
• Average daily rate (ADR): US$159.82 (+2.6%)
• Revenue per available room (RevPAR): US$113.17 (+1.5%)
emphasis added
 Click on graph for larger image.
The red line is for 2023, black is 2020, blue is the median, and dashed light blue is for 2022. Dashed purple is for 2018, the record year for hotel occupancy.
The 4-week average of the occupancy rate is at the median rate for the period 2000 through 2022 (Blue).
Note: Y-axis doesn't start at zero to better show the seasonal change.
The 4-week average of the occupancy rate will increase during the summer travel season.
NAR: Existing-Home Sales Increased to 4.30 million SAAR in May; Median Prices Declined 3.1% YoY
by Calculated Risk on 6/22/2023 10:41:00 AM
Today, in the CalculatedRisk Real Estate Newsletter: NAR: Existing-Home Sales Increased to 4.30 million SAAR in May; Median Prices Declined 3.1% YoY
Excerpt:
On prices, the NAR reported:There is much more in the article. You can subscribe at https://calculatedrisk.substack.com/ Please subscribe!The median existing-home price for all housing types in May was $396,100, a decline of 3.1% from May 2022 ($408,600). Prices grew in the Northeast and Midwest but fell in the South and West.Median prices are distorted by the mix (repeat sales indexes like Case-Shiller and FHFA are probably better for measuring prices).
The YoY change in the median price peaked at 25.2% in May 2021 and prices are now down 3.1% YoY. Median house prices increased 2.6% from April to May and are down 4.3% from the peak in June 2022 (NSA). It is likely the Case-Shiller index will be down soon year-over-year.
Note that closed sales in May were mostly for contracts signed in March and April. Mortgage rates, according to the Freddie Mac PMMS, average around 6.4% in March and April. June sales will be for contracts signed in April and May, when mortgage rates also averaged around 6.4%, so closed sales will likely be similar in June compared to May.

NAR: Existing-Home Sales Increased to 4.30 million SAAR in May
by Calculated Risk on 6/22/2023 10:11:00 AM
From the NAR: Existing-Home Sales Edged Higher by 0.2% in May
Existing-home sales marginally increased in May, according to the National Association of REALTORS®. Sales were mixed among the four major U.S. regions, with the South and West posting improvements and the Northeast and Midwest experiencing pullbacks. All four regions experienced year-over-year sales declines.
Total existing-home sales – completed transactions that include single-family homes, townhomes, condominiums and co-ops – rose 0.2% from April to a seasonally adjusted annual rate of 4.30 million in May. Year-over-year, sales dropped 20.4% (down from 5.40 million in May 2022).
...
Total housing inventory registered at the end of May was 1.08 million units, up 3.8% from April but down 6.1% from one year ago (1.15 million). Unsold inventory sits at a 3.0-month supply at the current sales pace, up from 2.9 months in April and 2.6 months in May 2022.
emphasis added
 Click on graph for larger image.
This graph shows existing home sales, on a Seasonally Adjusted Annual Rate (SAAR) basis since 1994.
Sales in May (4.30 million SAAR) were up 0.2% from the previous month and were 20.4% below the May 2022 sales rate.
The second graph shows nationwide inventory for existing homes.
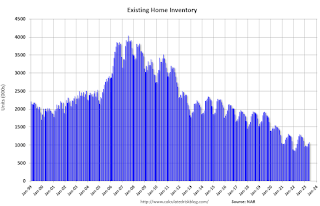 According to the NAR, inventory increased to 1.08 million in May from 1.04 million in April.
 According to the NAR, inventory increased to 1.08 million in May from 1.04 million in April.
Headline inventory is not seasonally adjusted, and inventory usually decreases to the seasonal lows in December and January, and peaks in mid-to-late summer.
The last graph shows the year-over-year (YoY) change in reported existing home inventory and months-of-supply. Since inventory is not seasonally adjusted, it really helps to look at the YoY change. Note: Months-of-supply is based on the seasonally adjusted sales and not seasonally adjusted inventory.
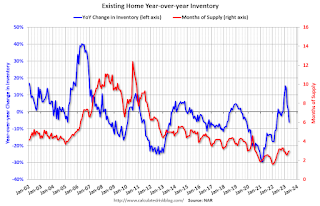 Inventory was down 6.1% year-over-year (blue) in May compared to May 2022.
Months of supply (red) increased to 3.0 months in May from 2.9 months in April.
This was slightly above the consensus forecast. I'll have more later.
The last graph shows the year-over-year (YoY) change in reported existing home inventory and months-of-supply. Since inventory is not seasonally adjusted, it really helps to look at the YoY change. Note: Months-of-supply is based on the seasonally adjusted sales and not seasonally adjusted inventory.
 Inventory was down 6.1% year-over-year (blue) in May compared to May 2022.
 Months of supply (red) increased to 3.0 months in May from 2.9 months in April.
This was slightly above the consensus forecast. I'll have more later.


