 RSS Feed
 by Calculated Risk on 6/27/2023 09:41:00 AM
Tuesday, June 27, 2023
Comments on April Case-Shiller and FHFA House Prices
Today, in the Calculated Risk Real Estate Newsletter: Case-Shiller: National House Price Index Decreased 0.2% year-over-year in April
Excerpt:
The recent increase in mortgage rates to near 7% will not impact the Case-Shiller index until reports are released in the Fall.
...
Here is a comparison of year-over-year change in median house prices from the NAR and the year-over-year change in the Case-Shiller index. Median prices are distorted by the mix and repeat sales indexes like Case-Shiller and FHFA are probably better for measuring prices. However, in general, the Case-Shiller index follows the median price.
The median price was down 3.1% year-over-year in May, and, as expected, the Case-Shiller National Index was down year-over-year in the April report.
Note: I’ll have more on real prices, price-to-rent and affordability later this week.
Seasonally adjusted house prices have increased over the last three months, and the big question is “Will house prices decline further later this year?”

There is much more in the article. You can subscribe at https://calculatedrisk.substack.com/
Case-Shiller: National House Price Index Decreased 0.2% year-over-year in April
by Calculated Risk on 6/27/2023 09:10:00 AM
S&P/Case-Shiller released the monthly Home Price Indices for April ("April" is a 3-month average of February, March and April closing prices).
This release includes prices for 20 individual cities, two composite indices (for 10 cities and 20 cities) and the monthly National index.
From S&P S&P CoreLogic Case-Shiller Index Continued Gains in April
The S&P CoreLogic Case-Shiller U.S. National Home Price NSA Index, covering all nine U.S. census divisions, reported a -0.2% annual decrease in April, down from a gain of 0.7% in the previous month. The 10-City Composite showed a decrease of -1.2%, down from the -0.7% decrease in the previous month. The 20-City Composite posted a -1.7% year-over-year loss, down from -1.1% in the previous month.
...
Before seasonal adjustment, the U.S. National Index posted a 1.3% month-over-month increase in April, while the 10-City and 20-City Composites both posted increases of 1.7%.
After seasonal adjustment, the U.S. National Index posted a month-over-month increase of 0.5%, while the 10-City Composite gained 1.0% and 20-City Composites posted an increase of 0.9%.
“The U.S. housing market continued to strengthen in April 2023, says Craig J. Lazzara, Managing Director at S&P DJI. “Home prices peaked in June 2022, declined until January 2023, and then began to recover. The National Composite rose by 1.3% in April (repeating March’s performance), and now stands only 2.4% below its June 2022 peak. Our 10- and 20-City Composites both gained 1.7% in April.
“The ongoing recovery in home prices is broadly based. Before seasonal adjustments, prices rose in all 20 cities in April (as they had also done in March). Seasonally adjusted data showed rising prices in 19 cities in April (versus 14 in March).
emphasis added
 Click on graph for larger image.
 The first graph shows the nominal seasonally adjusted Composite 10, Composite 20 and National indices (the Composite 20 was started in January 2000).
The Composite 10 index is up 0.5% in April (SA) and down 2.7% from the recent peak in June 2022.
The Composite 20 index is up 1.0% (SA) in April and down 3.3% from the recent peak in June 2022.
The National index is up 0.9% (SA) in April and is down 1.8% from the peak in June 2022.
 The second graph shows the year-over-year change in all three indices.
The Composite 10 SA is down 1.2% year-over-year. The Composite 20 SA is down 1.7% year-over-year.
The National index SA is down 0.2% year-over-year.
Annual price changes were below expectations. I'll have more later.
Monday, June 26, 2023
Tuesday: Case-Shiller House Prices, New Home Sales, Durable Goods
by Calculated Risk on 6/26/2023 09:02:00 PM
 From Matthew Graham at Mortgage News Daily: Mortgage Rates Effectively Unchanged Near Recent Highs
The average 30yr fixed mortgage rate has been holding just under 7% for the entire month, making June the least volatile month in well over a year. [30 year fixed 6.91%]Tuesday:
emphasis added
• At 8:30 AM ET, Durable Goods Orders for May from the Census Bureau. The consensus is for a 1.3% decrease in durable goods orders.
• At 9:00 AM, S&P/Case-Shiller House Price Index for April. The consensus is for a 1.1% year-over-year decrease in the Comp 20 index for April.
• Also at 9:00 AM, FHFA House Price Index for April. This was originally a GSE only repeat sales, however there is also an expanded index.
• At 10:00 AM, New Home Sales for May from the Census Bureau. The consensus is for 657 thousand SAAR, down from 683 thousand in April.
• Also at 10:00 AM, Richmond Fed Survey of Manufacturing Activity for June.
Fannie and Freddie Serious Delinquencies in May: Single Family Declined, Multi-Family Increased
by Calculated Risk on 6/26/2023 04:57:00 PM
Today, in the Calculated Risk Real Estate Newsletter: Fannie and Freddie Serious Delinquencies in May: Single Family Declined, Multi-Family Increased
Brief excerpt:
Single-family serious delinquencies continued to decline in May, however, multi-family serious delinquencies are now increasing.You can subscribe at https://calculatedrisk.substack.com/.
...
Freddie Mac reports that multi-family delinquencies increased to 0.20% in May, up from 0.07% in May 2022.
This graph shows the Freddie multi-family serious delinquency rate since 2012. Rates were still high in 2012 following the housing bust and financial crisis.
The multi-family rate increased following the pandemic and has increased recently as rent growth has slowed, vacancy rates have increased, and interest rates have increased sharply. This will be something to watch as rents soften.

Update on Four High Frequency Indicators
by Calculated Risk on 6/26/2023 10:01:00 AM
I stopped the weekly updates of high frequency indicators at the end of 2022.
Here is a mid-year look at four indicators:
The TSA is providing daily travel numbers.
This data is as of June 25th.
 Click on graph for larger image.
This data shows the 7-day average of daily total traveler throughput from the TSA for 2019 (Light Blue), 2020 (Black), 2021 (Blue), 2022 (Orange) and 2023 (Red).
The dashed line is the percent of 2019 for the seven-day average.
The 7-day average is at the same level as the same week in 2019 (100.5% of 2019). (Dashed line)
Air travel - as a percent of 2019 - is tracking pre-pandemic levels.
----- Movie Tickets: Box Office Mojo -----
 This data shows domestic box office for each week and the median for the years 2016 through 2019 (dashed light blue).
 This data shows domestic box office for each week and the median for the years 2016 through 2019 (dashed light blue).
 Black is 2020, Blue is 2021 and Red is 2022.
The data is from BoxOfficeMojo through June 22nd.
Note that the data is usually noisy week-to-week and depends on when blockbusters are released.
Movie ticket sales (dollars) are running close to the pre-pandemic levels.
Note that the data is usually noisy week-to-week and depends on when blockbusters are released.
Movie ticket sales (dollars) are running close to the pre-pandemic levels.
 This graph shows the seasonal pattern for the hotel occupancy rate using the four-week average.
 The red line is for 2023, black is 2020, blue is the median, and dashed light blue is for 2022. Dashed purple is for 2018, the record year for hotel occupancy.
This data is through June 17th. The occupancy rate was down 1,1% compared to the same week in 2022.
The 4-week average of the occupancy rate is at the median rate for the period 2000 through 2022 (Blue).
Notes: Y-axis doesn't start at zero to better show the seasonal change.
Notes: Y-axis doesn't start at zero to better show the seasonal change.

This graph, based on weekly data from the U.S. Energy Information Administration (EIA) shows gasoline supplied compared to the same week of 2019.
Blue is for 2020. Purple is for 2021, and Orange is for 2022, and Red is for 2023.
Gasoline supplied in 2023 is running about 5% below 2019 levels.
Housing June 26th Weekly Update: Inventory Increased 2.0% Week-over-week
by Calculated Risk on 6/26/2023 08:21:00 AM
Altos reports that active single-family inventory was up 2.0% week-over-week.
 Click on graph for larger image.
This inventory graph is courtesy of Altos Research.
As of June 16th, inventory was at 460 thousand (7-day average), compared to 451 thousand the prior week.
Year-to-date, inventory is down 6.3%. And inventory is up 13.4% from the seasonal bottom ten weeks ago.

The red line is for 2023. The black line is for 2019. Note that inventory is up from the previous two years (the record low was in 2022), but still well below normal levels.
Inventory was up 4.3% compared to the same week in 2022 (last week it was up 8.5%), and down 51.8% compared to the same week in 2019 (last week down 52.1%).
It appears likely inventory will be down year-over-year next week.
Mike Simonsen discusses this data regularly on Youtube.
Sunday, June 25, 2023
Sunday Night Futures
by Calculated Risk on 6/25/2023 07:05:00 PM
Weekend:
• Schedule for Week of June 25, 2023
Monday:
• At 10:30 AM ET, Dallas Fed Survey of Manufacturing Activity for June.
From CNBC: Pre-Market Data and Bloomberg futures S&P 500 are up 6 and DOW futures are up 40 (fair value).
Oil prices were down over the last week with WTI futures at $69.16 per barrel and Brent at $73.85 per barrel. A year ago, WTI was at $109, and Brent was at $117 - so WTI oil prices are down about 37% year-over-year.
Here is a graph from Gasbuddy.com for nationwide gasoline prices. Nationally prices are at $3.56 per gallon. A year ago, prices were at $4.90 per gallon, so gasoline prices are down $1.34 per gallon year-over-year.
A Very Early Look at 2024 Cost-Of-Living Adjustments and Maximum Contribution Base
by Calculated Risk on 6/25/2023 08:12:00 AM
The BLS reported on June 13th:
The Consumer Price Index for Urban Wage Earners and Clerical Workers (CPI-W) increased 3.6 percent over the last 12 months to an index level of 298.382 (1982-84=100). For the month, the index increased 0.2 percent prior to seasonal adjustment.CPI-W is the index that is used to calculate the Cost-Of-Living Adjustments (COLA). The calculation dates have changed over time (see Cost-of-Living Adjustments), but the current calculation uses the average CPI-W for the three months in Q3 (July, August, September) and compares to the average for the highest previous average of Q3 months. Note: this is not the headline CPI-U and is not seasonally adjusted (NSA).
• In 2022, the Q3 average of CPI-W was 291.901.
The 2022 Q3 average was the highest Q3 average, so we only have to compare Q3 this year to last year.
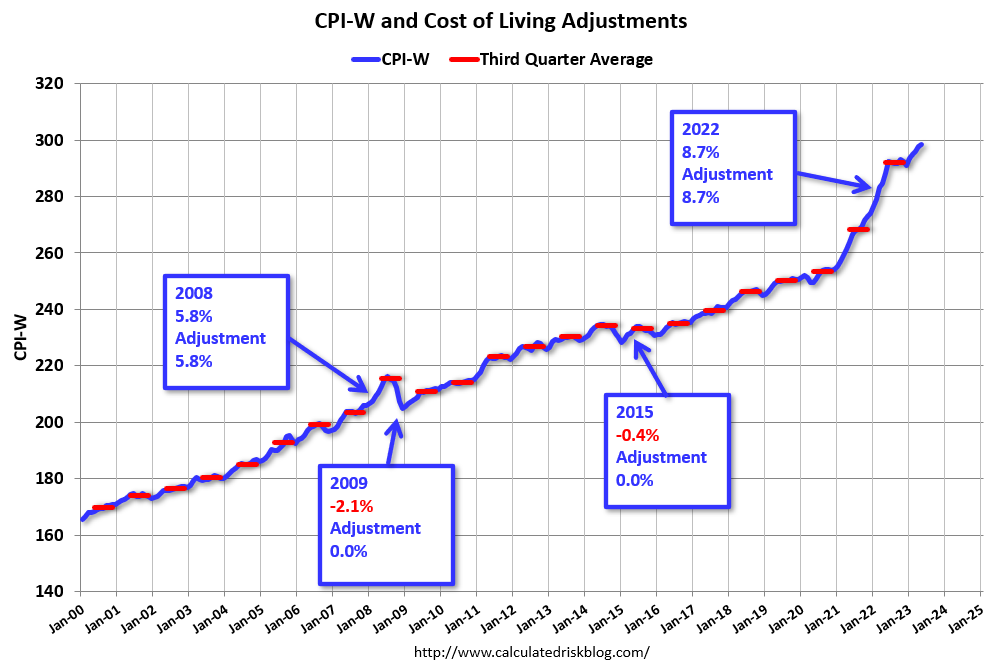 Click on graph for larger image.
This graph shows CPI-W since January 2000. The red lines are the Q3 average of CPI-W for each year.
Note: The year labeled is for the calculation, and the adjustment is effective for December of that year (received by beneficiaries in January of the following year).
CPI-W was up 3.6% year-over-year in May, and although this is very early - we need the data for July, August and September - my very early guess is COLA will probably be close to 3% this year, the smallest increase since 1.3% in 2021.
Contribution and Benefit Base
The contribution base will be adjusted using the National Average Wage Index. This is based on a one-year lag. The National Average Wage Index is not available for 2022 yet, wages increased solidly in 2022. If wages increased 5% in 2022, then the contribution base next year will increase to around $168,200 in 2024, from the current $160,200.
Remember - this is a very early look. What matters is average CPI-W, NSA, for all three months in Q3 (July, August and September).
Saturday, June 24, 2023
Real Estate Newsletter Articles this Week: Record Number of Multi-Family Housing Units Under Construction
by Calculated Risk on 6/24/2023 02:11:00 PM
At the Calculated Risk Real Estate Newsletter this week:
• NAR: Existing-Home Sales Increased to 4.30 million SAAR in May; Median Prices Declined 3.1% YoY in May
• May Housing Starts: Record Number of Multi-Family Housing Units Under Construction
• Some More Good News for Homebuilders
• Final Look at Local Housing Markets in May
• California Home Sales Down 23.6% YoY in May, Median Prices Decline 6.4% YoY
This is usually published 4 to 6 times a week and provides more in-depth analysis of the housing market.
You can subscribe at https://calculatedrisk.substack.com/
Most content is available for free (and no Ads), but please subscribe!
Schedule for Week of June 25, 2023
by Calculated Risk on 6/24/2023 08:11:00 AM
The key reports this week are May New Home sales, the third estimate of Q1 GDP, Personal Income and Outlays for May and April Case-Shiller house prices.
For manufacturing, the June Richmond and Dallas Fed manufacturing surveys will be released.
10:30 AM: Dallas Fed Survey of Manufacturing Activity for June.
8:30 AM: Durable Goods Orders for May from the Census Bureau. The consensus is for a 1.3% decrease in durable goods orders.
 9:00 AM: S&P/Case-Shiller House Price Index for April.
This graph shows the year-over-year change in the seasonally adjusted National Index, Composite 10 and Composite 20 indexes through the most recent report (the Composite 20 was started in January 2000).
The consensus is for a 1.1% year-over-year decrease in the Comp 20 index for April.
9:00 AM: FHFA House Price Index for April. This was originally a GSE only repeat sales, however there is also an expanded index.
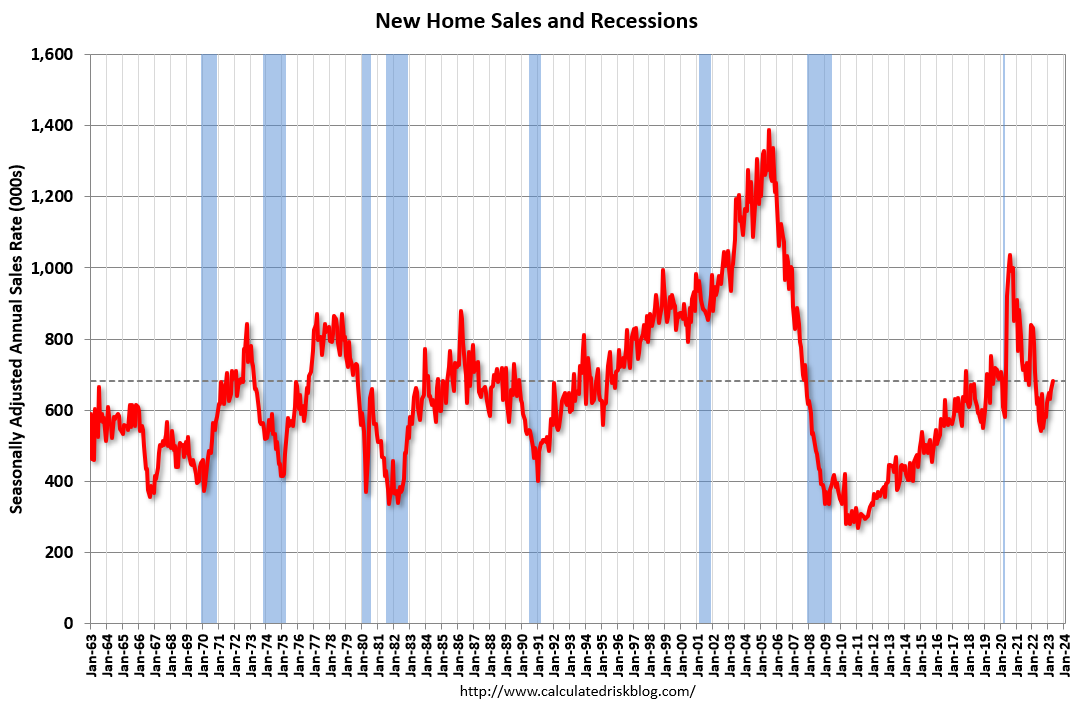 10:00 AM: New Home Sales for May from the Census Bureau.
 This graph shows New Home Sales since 1963. The dashed line is the sales rate for last month.
The consensus is for 657 thousand SAAR, down from 683 thousand in April.
10:00 AM: Richmond Fed Survey of Manufacturing Activity for June.
7:00 AM ET: The Mortgage Bankers Association (MBA) will release the results for the mortgage purchase applications index.
9:30 AM: Discussion, Fed Chair Jerome Powell, Policy Panel Discussion, At the European Central Bank (ECB) Forum on Central Banking 2023, Sintra, Portugal
4:30 PM: Fed Bank Stress Test Results
2:30 AM: Discussion, Fed Chair Jerome Powell, Dialogue with Bank of Spain Governor Pablo Hernández de Cos, At the Banco de España Fourth Conference on Financial Stability, Madrid, Spain
8:30 AM: The initial weekly unemployment claims report will be released. The consensus is for 266 thousand initial claims, up from 264 thousand last week.
8:30 AM: Gross Domestic Product, 1st quarter 2023 (Third estimate). The consensus is that real GDP increased 1.4% annualized in Q1, up from the second estimate of a 1.3% increase.
10:00 AM: Pending Home Sales Index for May. The consensus is for a 0.3% decrease in the index.
8:30 AM ET: Personal Income and Outlays, May 2023. The consensus is for a 0.4% increase in personal income, and for a 0.2% increase in personal spending. And for the Core PCE price index to increase 0.4%. PCE prices are expected to be up 3.8% YoY, and core PCE prices up 4.7% YoY.
9:45 AM: Chicago Purchasing Managers Index for June.
10:00 AM: University of Michigan's Consumer sentiment index (Final for June). The consensus is for a reading of 63.9.


