by Calculated Risk on 6/27/2023 08:27:00 PM
Tuesday, June 27, 2023
Wednesday: Fed Chair Powell, Stress Test Results
Wednesday:
• At 7:00 AM ET, The Mortgage Bankers Association (MBA) will release the results for the mortgage purchase applications index.
• At 9:30 AM, Discussion, Fed Chair Jerome Powell, Policy Panel Discussion, At the European Central Bank (ECB) Forum on Central Banking 2023, Sintra, Portugal
• At 4:30 PM, Fed Bank Stress Test Results
New Home Sales increase to 763,000 Annual Rate in May; Median New Home Price is Down 16.2% from the Peak
by Calculated Risk on 6/27/2023 10:46:00 AM
Today, in the Calculated Risk Real Estate Newsletter: New Home Sales increase to 763,000 Annual Rate in May
Brief excerpt:
The next graph shows new home sales for 2022 and 2023 by month (Seasonally Adjusted Annual Rate). Sales in May 2023 were up 20.0% from May 2022. Year-to-date sales are down 4.7% compared to the same period in 2022.You can subscribe at https://calculatedrisk.substack.com/.
As expected, new home sales were up year-over-year in May.
...
As previously discussed, the Census Bureau overestimates sales, and underestimates inventory when cancellation rates are rising, see: New Home Sales and Cancellations: Net vs Gross Sales. This has reversed now since cancellation rates have started to decline. When a previously cancelled home is resold, the home builder counts it as a sale, but the Census Bureau does not (since it was already counted).
[Rick Palacios Jr., Director of Research at John Burns Research and Consulting] told me that the builders have resold most of their previously cancelled homes.Yes on resold question. If that weren’t true we’d be seeing finished standing inventory still high, but it too is quickly falling in our survey & also below what builders (and we) consider normal. All part of why builders started stepping on the starts gas pedal last few months.There are still a large number of homes under construction, but in general, this is another positive report for new home sales.
New Home Sales increase to 763,000 Annual Rate in May
by Calculated Risk on 6/27/2023 10:06:00 AM
The Census Bureau reports New Home Sales in May were at a seasonally adjusted annual rate (SAAR) of 763 thousand.
The previous three months were revised down slightly, combined.
Sales of new single‐family houses in May 2023 were at a seasonally adjusted annual rate of 763,000, according to estimates released jointly today by the U.S. Census Bureau and the Department of Housing and Urban Development. This is 12.2 percent above the revised April rate of 680,000 and is 20.0 percent above the May 2022 estimate of 636,000.
emphasis added
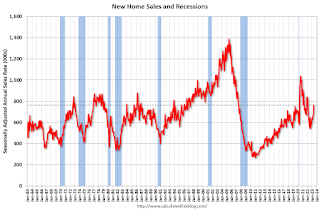 Click on graph for larger image.
The first graph shows New Home Sales vs. recessions since 1963. The dashed line is the current sales rate.
New home sales are above pre-pandemic levels.
The second graph shows New Home Months of Supply.
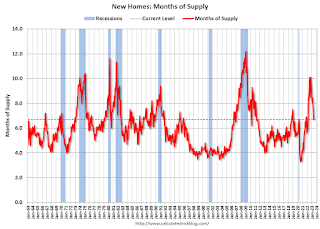 The months of supply decreased in May to 6.7 months from 7.6 months in April.
 The all-time record high was 12.2 months of supply in January 2009. The all-time record low was 3.3 months in August 2020.
This is above the top of the normal range (about 4 to 6 months of supply is normal).
"The seasonally‐adjusted estimate of new houses for sale at the end of May was 428,000. This represents a supply of 6.7 months at the current sales rate."Sales were well above expectations of 657 thousand SAAR, however, sales in the three previous months were revised down slightly, combined. I'll have more later today.
Comments on April Case-Shiller and FHFA House Prices
by Calculated Risk on 6/27/2023 09:41:00 AM
Today, in the Calculated Risk Real Estate Newsletter: Case-Shiller: National House Price Index Decreased 0.2% year-over-year in April
Excerpt:
The recent increase in mortgage rates to near 7% will not impact the Case-Shiller index until reports are released in the Fall.
...
Here is a comparison of year-over-year change in median house prices from the NAR and the year-over-year change in the Case-Shiller index. Median prices are distorted by the mix and repeat sales indexes like Case-Shiller and FHFA are probably better for measuring prices. However, in general, the Case-Shiller index follows the median price.
The median price was down 3.1% year-over-year in May, and, as expected, the Case-Shiller National Index was down year-over-year in the April report.
Note: I’ll have more on real prices, price-to-rent and affordability later this week.
Seasonally adjusted house prices have increased over the last three months, and the big question is “Will house prices decline further later this year?”
Case-Shiller: National House Price Index Decreased 0.2% year-over-year in April
by Calculated Risk on 6/27/2023 09:10:00 AM
S&P/Case-Shiller released the monthly Home Price Indices for April ("April" is a 3-month average of February, March and April closing prices).
This release includes prices for 20 individual cities, two composite indices (for 10 cities and 20 cities) and the monthly National index.
From S&P S&P CoreLogic Case-Shiller Index Continued Gains in April
The S&P CoreLogic Case-Shiller U.S. National Home Price NSA Index, covering all nine U.S. census divisions, reported a -0.2% annual decrease in April, down from a gain of 0.7% in the previous month. The 10-City Composite showed a decrease of -1.2%, down from the -0.7% decrease in the previous month. The 20-City Composite posted a -1.7% year-over-year loss, down from -1.1% in the previous month.
...
Before seasonal adjustment, the U.S. National Index posted a 1.3% month-over-month increase in April, while the 10-City and 20-City Composites both posted increases of 1.7%.
After seasonal adjustment, the U.S. National Index posted a month-over-month increase of 0.5%, while the 10-City Composite gained 1.0% and 20-City Composites posted an increase of 0.9%.
“The U.S. housing market continued to strengthen in April 2023, says Craig J. Lazzara, Managing Director at S&P DJI. “Home prices peaked in June 2022, declined until January 2023, and then began to recover. The National Composite rose by 1.3% in April (repeating March’s performance), and now stands only 2.4% below its June 2022 peak. Our 10- and 20-City Composites both gained 1.7% in April.
“The ongoing recovery in home prices is broadly based. Before seasonal adjustments, prices rose in all 20 cities in April (as they had also done in March). Seasonally adjusted data showed rising prices in 19 cities in April (versus 14 in March).
emphasis added
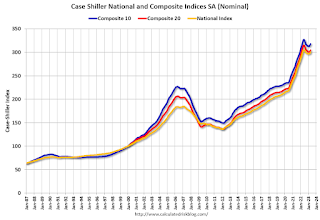 Click on graph for larger image.
 The first graph shows the nominal seasonally adjusted Composite 10, Composite 20 and National indices (the Composite 20 was started in January 2000).
The Composite 10 index is up 0.5% in April (SA) and down 2.7% from the recent peak in June 2022.
The Composite 20 index is up 1.0% (SA) in April and down 3.3% from the recent peak in June 2022.
The National index is up 0.9% (SA) in April and is down 1.8% from the peak in June 2022.
 The second graph shows the year-over-year change in all three indices.
The Composite 10 SA is down 1.2% year-over-year. The Composite 20 SA is down 1.7% year-over-year.
The National index SA is down 0.2% year-over-year.
Annual price changes were below expectations. I'll have more later.
Monday, June 26, 2023
Tuesday: Case-Shiller House Prices, New Home Sales, Durable Goods
by Calculated Risk on 6/26/2023 09:02:00 PM

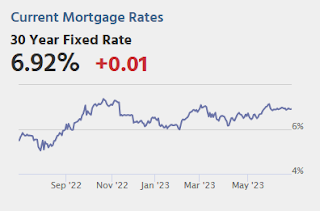
The average 30yr fixed mortgage rate has been holding just under 7% for the entire month, making June the least volatile month in well over a year. [30 year fixed 6.91%]Tuesday:
emphasis added
• At 8:30 AM ET, Durable Goods Orders for May from the Census Bureau. The consensus is for a 1.3% decrease in durable goods orders.
• At 9:00 AM, S&P/Case-Shiller House Price Index for April. The consensus is for a 1.1% year-over-year decrease in the Comp 20 index for April.
• Also at 9:00 AM, FHFA House Price Index for April. This was originally a GSE only repeat sales, however there is also an expanded index.
• At 10:00 AM, New Home Sales for May from the Census Bureau. The consensus is for 657 thousand SAAR, down from 683 thousand in April.
• Also at 10:00 AM, Richmond Fed Survey of Manufacturing Activity for June.
Fannie and Freddie Serious Delinquencies in May: Single Family Declined, Multi-Family Increased
by Calculated Risk on 6/26/2023 04:57:00 PM
Today, in the Calculated Risk Real Estate Newsletter: Fannie and Freddie Serious Delinquencies in May: Single Family Declined, Multi-Family Increased
Brief excerpt:
Single-family serious delinquencies continued to decline in May, however, multi-family serious delinquencies are now increasing.You can subscribe at https://calculatedrisk.substack.com/.
...
Freddie Mac reports that multi-family delinquencies increased to 0.20% in May, up from 0.07% in May 2022.
This graph shows the Freddie multi-family serious delinquency rate since 2012. Rates were still high in 2012 following the housing bust and financial crisis.
The multi-family rate increased following the pandemic and has increased recently as rent growth has slowed, vacancy rates have increased, and interest rates have increased sharply. This will be something to watch as rents soften.
Update on Four High Frequency Indicators
by Calculated Risk on 6/26/2023 10:01:00 AM
I stopped the weekly updates of high frequency indicators at the end of 2022.
The TSA is providing daily travel numbers.
This data is as of June 25th.
 Click on graph for larger image.
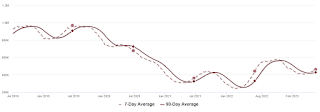
This data shows the 7-day average of daily total traveler throughput from the TSA for 2019 (Light Blue), 2020 (Black), 2021 (Blue), 2022 (Orange) and 2023 (Red).
The dashed line is the percent of 2019 for the seven-day average.
The 7-day average is at the same level as the same week in 2019 (100.5% of 2019). (Dashed line)
 This data shows domestic box office for each week and the median for the years 2016 through 2019 (dashed light blue).
 Note that the data is usually noisy week-to-week and depends on when blockbusters are released.
Movie ticket sales (dollars) are running close to the pre-pandemic levels.
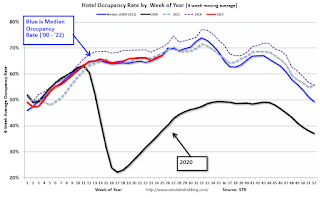 This graph shows the seasonal pattern for the hotel occupancy rate using the four-week average.
 The red line is for 2023, black is 2020, blue is the median, and dashed light blue is for 2022. Dashed purple is for 2018, the record year for hotel occupancy.
This data is through June 17th. The occupancy rate was down 1,1% compared to the same week in 2022.
Notes: Y-axis doesn't start at zero to better show the seasonal change.
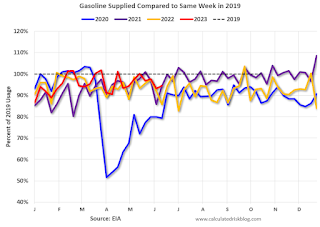
Blue is for 2020. Purple is for 2021, and Orange is for 2022, and Red is for 2023.
Gasoline supplied in 2023 is running about 5% below 2019 levels.
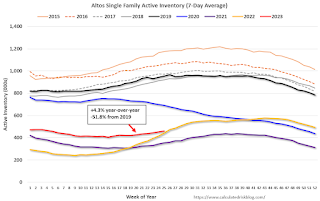
Housing June 26th Weekly Update: Inventory Increased 2.0% Week-over-week
by Calculated Risk on 6/26/2023 08:21:00 AM
 Click on graph for larger image.
This inventory graph is courtesy of Altos Research.
Sunday, June 25, 2023
Sunday Night Futures
by Calculated Risk on 6/25/2023 07:05:00 PM
Weekend:
• Schedule for Week of June 25, 2023
Monday:
• At 10:30 AM ET, Dallas Fed Survey of Manufacturing Activity for June.
From CNBC: Pre-Market Data and Bloomberg futures S&P 500 are up 6 and DOW futures are up 40 (fair value).
Oil prices were down over the last week with WTI futures at $69.16 per barrel and Brent at $73.85 per barrel. A year ago, WTI was at $109, and Brent was at $117 - so WTI oil prices are down about 37% year-over-year.
Here is a graph from Gasbuddy.com for nationwide gasoline prices. Nationally prices are at $3.56 per gallon. A year ago, prices were at $4.90 per gallon, so gasoline prices are down $1.34 per gallon year-over-year.

