 RSS Feed
 by Calculated Risk on 6/29/2023 08:38:00 AM
Thursday, June 29, 2023
Weekly Initial Unemployment Claims Decrease to 239,000
The DOL reported:
In the week ending June 24, the advance figure for seasonally adjusted initial claims was 239,000, a decrease of 26,000 from the previous week's revised level. The previous week's level was revised up by 1,000 from 264,000 to 265,000. The 4-week moving average was 257,500, an increase of 1,500 from the previous week's revised average. This is the highest level for this average since November 13, 2021 when it was 260,000. The previous week's average was revised up by 250 from 255,750 to 256,000.The following graph shows the 4-week moving average of weekly claims since 1971.
emphasis added
 Click on graph for larger image.
The dashed line on the graph is the current 4-week average. The four-week average of weekly unemployment claims increased to 257,500.
The previous week was revised up.
Weekly claims were lower than the consensus forecast.
Q1 GDP Growth Revised Up to 2.0% Annual Rate
by Calculated Risk on 6/29/2023 08:34:00 AM
From the BEA: Gross Domestic Product (Third Estimate), Corporate Profits (Revised Estimate), and GDP by Industry, First Quarter 2023
Real gross domestic product (GDP) increased at an annual rate of 2.0 percent in the first quarter of 2023, according to the "third" estimate released by the Bureau of Economic Analysis. In the fourth quarter, real GDP increased 2.6 percent.Here is a Comparison of Third and Second Estimates. PCE growth was revised up from 3.8% to 4.2%. Residential investment was revised up from -5.4% to -4.0%.
The GDP estimate released today is based on more complete source data than were available for the "second" estimate issued last month. In the second estimate, the increase in real GDP was 1.3 percent. The updated estimates primarily reflected upward revisions to exports and consumer spending that were partly offset by downward revisions to nonresidential fixed investment and federal government spending. Imports, which are a subtraction in the calculation of GDP, were revised down (refer to "Updates to GDP").
The increase in real GDP in the first quarter reflected increases in consumer spending, exports, state and local government spending, federal government spending, and nonresidential fixed investment that were partly offset by decreases in private inventory investment and residential fixed investment. Imports increased .
emphasis added
Wednesday, June 28, 2023
Thursday: Fed Chair Powell, Unemployment Claims, GDP, Pending Home Sales
by Calculated Risk on 6/28/2023 08:15:00 PM
 Note: Mortgage rates are from MortgageNewsDaily.com and are for top tier scenarios.
Thursday:
• At 2:30 AM ET, Discussion, Fed Chair Jerome Powell, Dialogue with Bank of Spain Governor Pablo Hernández de Cos, At the Banco de España Fourth Conference on Financial Stability, Madrid, Spain
• At 8:30 AM, The initial weekly unemployment claims report will be released. The consensus is for 266 thousand initial claims, up from 264 thousand last week.
• Also at 8:30 AM, Gross Domestic Product, 1st quarter 2023 (Third estimate). The consensus is that real GDP increased 1.4% annualized in Q1, up from the second estimate of a 1.3% increase.
• At 10:00 AM, Pending Home Sales Index for May. The consensus is for a 0.3% decrease in the index.
Las Vegas May 2023: Visitor Traffic Up 1.5% YoY; Convention Traffic up 16% YoY
by Calculated Risk on 6/28/2023 02:55:00 PM
Note: I like using Las Vegas as a measure of recovery for both leisure (visitors) and business (conventions).
From the Las Vegas Visitor Authority: May 2023 Las Vegas Visitor Statistics
Supported by strong demand along with multiple weekend music festivals including the Lovers & Friends festival, Sick New World festival and the recurring Electric Daisy Carnival (EDC) event, Las Vegas hosted approx. 3.5M visitors, 1.5% ahead of last May.
Overall hotel occupancy reached 84.4% for the month (+1.8 pts YoY). Weekend occupancy was healthy at 93.2%, +1.3 pts YoY, and Midweek occupancy approached 81%, surpassing last May by 2.0 pts.
Overall ADR exceeded $183, +4.3% from May 2022 while RevPAR neared $155, +6.6% YoY
 Click on graph for larger image.
 The first graph shows visitor traffic for 2019 (Black), 2020 (light blue), 2021 (purple), 2022 (orange), and 2023 (red).
Visitor traffic was down 5.2% compared to the same month in 2019.
Visitor traffic was up 1.5% compared to last May.
The second graph shows convention traffic.
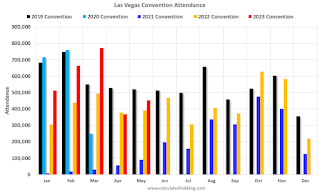
Convention traffic was down 12.8% compared to May 2019, and up 16.1% compared to May 2022.The second graph shows convention traffic.

Note: There was almost no convention traffic from April 2020 through May 2021.
Inflation Adjusted House Prices 3.8% Below Peak; Price-to-rent index is 8.4% below recent peak
by Calculated Risk on 6/28/2023 11:11:00 AM
Today, in the Calculated Risk Real Estate Newsletter: Inflation Adjusted House Prices 3.8% Below Peak; Price-to-rent index is 8.4% below recent peak
Excerpt:
It has been over 17 years since the bubble peak. In the April Case-Shiller house price index released yesterday, the seasonally adjusted National Index (SA), was reported as being 62% above the bubble peak in 2006. However, in real terms, the National index (SA) is about 11% above the bubble peak (and historically there has been an upward slope to real house prices). The composite 20, in real terms, is 1% above the bubble peak.
The inflation adjusted indexes increased in real terms in April using CPI ex-shelter.
People usually graph nominal house prices, but it is also important to look at prices in real terms. As an example, if a house price was $200,000 in January 2000, the price would be $341,000 today adjusted for inflation (70.5% increase). That is why the second graph below is important - this shows "real" prices.
The third graph shows the price-to-rent ratio, and the fourth graph is the affordability index. The last graph shows the 5-year real return based on the Case-Shiller National Index.
There is much more in the article. You can subscribe at https://calculatedrisk.substack.com/
CNBC: Fed Chair "Powell says more ‘restriction’ is coming"
by Calculated Risk on 6/28/2023 09:59:00 AM
Fed Chair Jerome Powell is participating in a panel discussion today at the European Central Bank (ECB) Forum on Central Banking 2023 in Sintra, Portugal.
From Jeff Cox at CNBC: Powell says more ‘restriction’ is coming, including possibility of hikes at consecutive meetings. Excerpt:
“We believe there’s more restriction coming,” Powell said during a monetary policy session in Sintra, Portugal. “What’s really driving it ... is a very strong labor market.”
...
“I wouldn’t take, you know, moving at consecutive meetings off the table,” he said during an exchange moderated by CNBC’s Sara Eisen
MBA: Mortgage Applications Increased in Weekly Survey
by Calculated Risk on 6/28/2023 07:00:00 AM
From the MBA: Mortgage Applications Increase in Latest MBA Weekly Survey
Mortgage applications increased 3.0 percent from one week earlier, according to data from the Mortgage Bankers Association’s (MBA) Weekly Mortgage Applications Survey for the week ending June 23, 2023. This week’s results include an adjustment for Juneteenth holiday.
The Market Composite Index, a measure of mortgage loan application volume, increased 3.0 percent on a seasonally adjusted basis from one week earlier. On an unadjusted basis, the Index decreased 8 percent compared with the previous week. The Refinance Index increased 3 percent from the previous week and was 32 percent lower than the same week one year ago. The seasonally adjusted Purchase Index increased 3 percent from one week earlier. The unadjusted Purchase Index decreased 8 percent compared with the previous week and was 21 percent lower than the same week one year ago.
“Mortgage rate changes varied across loan types last week, with the 30-year fixed rate increasing slightly to 6.75 percent. The spread between the jumbo and conforming rates widened to 16 basis points, the third week in a row that the jumbo rate was higher than the conforming rate. To put this into perspective, from May 2022 to May 2023, the jumbo rate averaged around 30 basis points less than the conforming rate,” said Joel Kan, MBA’s Vice President and Deputy Chief Economist. “Purchase applications increased for the third consecutive week to the highest level of activity since early May but remained more than 20 percent lower than year ago levels. New home sales have been driving purchase activity in recent months as buyers look for options beyond the existing-home market. Existing-home sales continued to be held back by a lack of for-sale inventory as many potential sellers are holding on to their lower-rate mortgages.
...
The average contract interest rate for 30-year fixed-rate mortgages with conforming loan balances ($726,200 or less) increased to 6.75 percent from 6.73 percent, with points remaining at 0.64 (including the origination fee) for 80 percent loan-to-value ratio (LTV) loans.
emphasis added
 Click on graph for larger image.
The first graph shows the MBA mortgage purchase index.
According to the MBA, purchase activity is down 21% year-over-year unadjusted.
Red is a four-week average (blue is weekly). This is at the highest level since early May - but close to the lowest level since the mid-'90s!

The second graph shows the refinance index since 1990.
With higher mortgage rates, the refinance index declined sharply in 2022 - and has mostly flat lined at a low level since then.
Tuesday, June 27, 2023
Wednesday: Fed Chair Powell, Stress Test Results
by Calculated Risk on 6/27/2023 08:27:00 PM
 Note: Mortgage rates are from MortgageNewsDaily.com and are for top tier scenarios.
Wednesday:
• At 7:00 AM ET, The Mortgage Bankers Association (MBA) will release the results for the mortgage purchase applications index.
• At 9:30 AM, Discussion, Fed Chair Jerome Powell, Policy Panel Discussion, At the European Central Bank (ECB) Forum on Central Banking 2023, Sintra, Portugal
• At 4:30 PM, Fed Bank Stress Test Results
New Home Sales increase to 763,000 Annual Rate in May; Median New Home Price is Down 16.2% from the Peak
by Calculated Risk on 6/27/2023 10:46:00 AM
Today, in the Calculated Risk Real Estate Newsletter: New Home Sales increase to 763,000 Annual Rate in May
Brief excerpt:
The next graph shows new home sales for 2022 and 2023 by month (Seasonally Adjusted Annual Rate). Sales in May 2023 were up 20.0% from May 2022. Year-to-date sales are down 4.7% compared to the same period in 2022.You can subscribe at https://calculatedrisk.substack.com/.
As expected, new home sales were up year-over-year in May.
...
As previously discussed, the Census Bureau overestimates sales, and underestimates inventory when cancellation rates are rising, see: New Home Sales and Cancellations: Net vs Gross Sales. This has reversed now since cancellation rates have started to decline. When a previously cancelled home is resold, the home builder counts it as a sale, but the Census Bureau does not (since it was already counted).
[Rick Palacios Jr., Director of Research at John Burns Research and Consulting] told me that the builders have resold most of their previously cancelled homes.Yes on resold question. If that weren’t true we’d be seeing finished standing inventory still high, but it too is quickly falling in our survey & also below what builders (and we) consider normal. All part of why builders started stepping on the starts gas pedal last few months.There are still a large number of homes under construction, but in general, this is another positive report for new home sales.

New Home Sales increase to 763,000 Annual Rate in May
by Calculated Risk on 6/27/2023 10:06:00 AM
The Census Bureau reports New Home Sales in May were at a seasonally adjusted annual rate (SAAR) of 763 thousand.
The previous three months were revised down slightly, combined.
Sales of new single‐family houses in May 2023 were at a seasonally adjusted annual rate of 763,000, according to estimates released jointly today by the U.S. Census Bureau and the Department of Housing and Urban Development. This is 12.2 percent above the revised April rate of 680,000 and is 20.0 percent above the May 2022 estimate of 636,000.
emphasis added
 Click on graph for larger image.
The first graph shows New Home Sales vs. recessions since 1963. The dashed line is the current sales rate.
New home sales are above pre-pandemic levels.
The second graph shows New Home Months of Supply.
 The months of supply decreased in May to 6.7 months from 7.6 months in April.
 The all-time record high was 12.2 months of supply in January 2009. The all-time record low was 3.3 months in August 2020.
This is above the top of the normal range (about 4 to 6 months of supply is normal).
"The seasonally‐adjusted estimate of new houses for sale at the end of May was 428,000. This represents a supply of 6.7 months at the current sales rate."Sales were well above expectations of 657 thousand SAAR, however, sales in the three previous months were revised down slightly, combined. I'll have more later today.


