 RSS Feed
 by Calculated Risk on 7/01/2023 08:11:00 AM
Saturday, July 01, 2023
Schedule for Week of July 2, 2023
The key report scheduled for this week is the June employment report to be released on Friday.
Other key reports include the June ISM Manufacturing survey, June Vehicle Sales, May Job Openings and the Trade Deficit for May.
10:00 AM: ISM Manufacturing Index for June. The consensus is for the ISM to be at 47.2, up from 46.9 in May.
10:00 AM: Construction Spending for May. The consensus is for a 0.5% increase in construction spending.
 Late in the day: Light vehicle sales for June.
The consensus is for light vehicle sales to be 15.3 million SAAR in June, up from 15.1 million in May (Seasonally Adjusted Annual Rate).
This graph shows light vehicle sales since the BEA started keeping data in 1967. The dashed line is the sales rate for last month.
Wards Auto is forecasting sales of 15.9 million SAAR in June.
US markets will close at 1:00 PM ET prior to the Independence Day Holiday.
All US markets will be closed in observance of Independence Day
8:00 AM: Corelogic House Price index for May.
2:00 PM: FOMC Minutes, Meeting of June 13-14, 2023
7:00 AM ET: The Mortgage Bankers Association (MBA) will release the results for the mortgage purchase applications index.
8:15 AM: The ADP Employment Report for June. This report is for private payrolls only (no government). The consensus is for 236,000 payroll jobs added in June, down from 278,000 in May.
8:30 AM: The initial weekly unemployment claims report will be released. The consensus is for 245 thousand initial claims, up from 239 thousand last week.
 8:30 AM: Trade Balance report for May from the Census Bureau.
 This graph shows the U.S. trade deficit, with and without petroleum, through the most recent report. The blue line is the total deficit, and the black line is the petroleum deficit, and the red line is the trade deficit ex-petroleum products.
The consensus is the trade deficit to be $69.8 billion. The U.S. trade deficit was at $74.6 billion the previous month.
 10:00 AM ET: Job Openings and Labor Turnover Survey for May from the BLS.
 This graph shows job openings (black line), hires (dark blue), Layoff, Discharges and other (red column), and Quits (light blue column) from the JOLTS.
Jobs openings increased in April to 10.1 million from 9.7 million in March.
The number of job openings (yellow) were down 14% year-over-year and quits were down 16% year-over-year.
10:00 AM: the ISM Services Index for June. The consensus is for a reading of 50.5, up from 50.3.
 8:30 AM: Employment Report for June. The consensus is for 200,000 jobs added, and for the unemployment rate to be unchanged at 3.7%.
There were 339,000 jobs added in May, and the unemployment rate was at 3.7%.
This graph shows the jobs added per month since January 2021.
Friday, June 30, 2023
June 30th COVID Update: New Pandemic Lows for Deaths and Hospitalizations
by Calculated Risk on 6/30/2023 07:11:00 PM
 Note: Mortgage rates are from MortgageNewsDaily.com and are for top tier scenarios.
Due to changes at the CDC, weekly cases are no longer updated.
After the first few weeks, the pandemic low for weekly deaths had been the week of July 7, 2021, at 1,690 deaths (until recently).
For COVID hospitalizations, the previous low was 9,821 (until recently).
| COVID Metrics | ||||
|---|---|---|---|---|
| Now | Week Ago | Goal | ||
| Hospitalized2 | 5,758 | 6,233 | ≤3,0001 | |
| Deaths per Week2 | 522 | 624 | ≤3501 | |
| 1my goals to stop weekly posts, 2Weekly for Currently Hospitalized, and Deaths 🚩 Increasing number weekly for Hospitalized and Deaths ✅ Goal met. | ||||
 Click on graph for larger image.
This graph shows the weekly (columns) number of deaths reported.
For deaths, I'm currently using 3 weeks ago for "now", since the most recent two weeks will be revised significantly.
Freddie Mac House Price Index Increased Slightly in May; Up 0.4% Year-over-year
by Calculated Risk on 6/30/2023 12:52:00 PM
Today, in the Calculated Risk Real Estate Newsletter: Freddie Mac House Price Index Increased Slightly in May; Up 0.4% Year-over-year
A brief excerpt:
On a year-over-year basis, the National FMHPI was up 0.4% in May, from up 0.7% YoY in April. The YoY increase peaked at 19.2% in July 2021. ...There is much more in the article. You can subscribe at https://calculatedrisk.substack.com/
In May, 15 states and D.C. were below their 2022 peaks, Seasonally Adjusted. The largest seasonally adjusted declines from the recent peak were in D.C. (-9.1%), Idaho (-7.2%), Nevada (-7.1%), Hawaii (-5.5%), Arizona (-5.2%), Utah (-4.9%), Washington (-4.3%), California (-3.7%), Oregon (-3.6%) and Wyoming (-5.0%).
For cities (Core-based Statistical Areas, CBSA), here are the 30 cities with the largest declines from the peak, seasonally adjusted.
...
The FMHPI is suggesting the YoY change in the Case-Shiller index will be close to unchanged for the next couple of months.
The big question is “Will house prices decline further later this year?” And I’ll post some thoughts on this next week.

Q2 GDP Tracking: Around 2%
by Calculated Risk on 6/30/2023 12:00:00 PM
From BofA:
Personal spending came in slight below expectations and with a downward revision in April. Overall, this decreased our personal consumption expenditure tracking estimate for 2Q. After rounding, it left our 2Q US GDP tracking estimate unchanged at 1.5%. [June 30th estimate]From Goldman:
emphasis added
[W]e left our Q2 GDP tracking estimate unchanged at +2.2% (qoq ar). [June 30th estimate]And from the Altanta Fed: GDPNow
The GDPNow model estimate for real GDP growth (seasonally adjusted annual rate) in the second quarter of 2023 is 2.2 percent on June 30, up from 1.8 percent on June 27. [June 30th estimate]
PCE Measure of Shelter Finally Slowing YoY
by Calculated Risk on 6/30/2023 08:47:00 AM
Here is a graph of the year-over-year change in shelter from the CPI report and housing from the PCE report this morning, both through May 2023.
 CPI Shelter was up 8.0% year-over-year in May, down from 8.1% in April, and down from the cycle peak of 8.2% in March 2023.
Housing (PCE) was up 8.3% YoY in May, down from 8.4% in April (April was the cycle peak).
Since asking rents are soft and Year-over-year Rent Growth Continues to Decelerate these measures will slow further in coming months.
Since asking rents are soft and Year-over-year Rent Growth Continues to Decelerate these measures will slow further in coming months.
Personal Income increased 0.4% in May; Spending increased 0.1%
by Calculated Risk on 6/30/2023 08:37:00 AM
The BEA released the Personal Income and Outlays report for May:
Personal income increased $91.2 billion (0.4 percent at a monthly rate) in May, according to estimates released today by the Bureau of Economic Analysis. Disposable personal income (DPI), personal income less personal current taxes, increased $86.7 billion (0.4 percent) and personal consumption expenditures (PCE) increased $18.9 billion (0.1 percent).The May PCE price index increased 3.8 percent year-over-year (YoY), down from 4.3 percent YoY in April, and down from the recent peak of 7.0 percent in June 2022.
The PCE price index increased 0.1 percent. Excluding food and energy, the PCE price index increased 0.3 percent. Real DPI increased 0.3 percent in May and real PCE decreased by less than 0.1 percent; goods decreased 0.4 percent and services increased 0.2 percent
emphasis added
The PCE price index, excluding food and energy, increased 4.6 percent YoY, down from 4.7 percent in April, and down from the recent peak of 5.4 percent in February 2022.
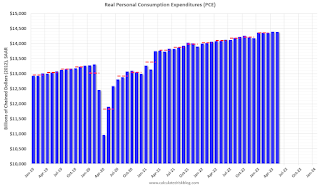
The following graph shows real Personal Consumption Expenditures (PCE) through May 2023 (2012 dollars). Note that the y-axis doesn't start at zero to better show the change.
 Click on graph for larger image.
The dashed red lines are the quarterly levels for real PCE.
Personal income was at expectations, and PCE was slightly below expectations.
Inflation was slightly below expectations.
Using the two-month method to estimate Q2 real PCE growth, real PCE was increasing at a 0.7% annual rate in Q2 2023. (Using the mid-month method, real PCE was increasing at 0.8%). This suggests weak PCE growth in Q2.
Thursday, June 29, 2023
Friday: Personal Income & Outlays
by Calculated Risk on 6/29/2023 08:45:00 PM
 Note: Mortgage rates are from MortgageNewsDaily.com and are for top tier scenarios.
Friday:
• At 8:30 AM ET, Personal Income and Outlays, May 2023. The consensus is for a 0.4% increase in personal income, and for a 0.2% increase in personal spending. And for the Core PCE price index to increase 0.4%. PCE prices are expected to be up 3.8% YoY, and core PCE prices up 4.7% YoY.
• At 9:45 AM, Chicago Purchasing Managers Index for June.
• At 10:00 AM, University of Michigan's Consumer sentiment index (Final for June). The consensus is for a reading of 63.9.
Hotels: Occupancy Rate Down 1.0% Year-over-year
by Calculated Risk on 6/29/2023 03:45:00 PM
U.S. hotel performance remained mostly flat from the previous week, and year-over-year comparisons remained mixed, according to STR‘s latest data through 24 June.The following graph shows the seasonal pattern for the hotel occupancy rate using the four-week average.
18-24 June 2023 (percentage change from comparable week in 2022):
• Occupancy: 71.4% (-1.0%)
• Average daily rate (ADR): US$159.00 (+0.9%)
• Revenue per available room (RevPAR): US$113.58 (-0.1%)
emphasis added
 Click on graph for larger image.
The red line is for 2023, black is 2020, blue is the median, and dashed light blue is for 2022. Dashed purple is for 2018, the record year for hotel occupancy.
The 4-week average of the occupancy rate is at the median rate for the period 2000 through 2022 (Blue).
Note: Y-axis doesn't start at zero to better show the seasonal change.
The 4-week average of the occupancy rate will increase during the summer travel season.
Realtor.com Reports Weekly Active Inventory Down Slightly YoY; New Listings Down 29% YoY
by Calculated Risk on 6/29/2023 12:43:00 PM
Realtor.com has monthly and weekly data on the existing home market. Here is their weekly report from economist Danielle Hale: Weekly Housing Trends View — Data Week Ending June 24, 2023
• Active inventory growth stalled completely, with for-sale homes lagging behind year ago levels for the first time in 59 weeks. As mortgage rates surged in 2022, buyers saw costs soar, and a large number of shoppers reoriented their housing plans. The time it took to sell a home lengthened and the number of homes for sale piled up. Flash forward a little more than a year, and this week, the number of homes actively for sale slipped compared to a year ago. The decline was slight–it actually rounds to zero–but it is notable in that it highlights a key reason why despite high costs home prices have not budged much.
• New listings–a measure of sellers putting homes up for sale–were down again this week, by 29% from one year ago. The number of newly listed homes has been lower than the same time the previous year for the past 51 weeks–nearly a whole year. And this week’s data shows an even larger gap.
 Here is a graph of the year-over-year change in inventory according to realtor.com.
 Inventory is down 0.3% year-over-year - this was the first YoY decrease in 59 weeks (since May 2022).
Inventory is still up from the record lows in the 2nd half of 2021 and early 2022, and it is unlikely we will see new record lows this year.
NAR: Pending Home Sales Down 2.7% in May; Down 22.2% Year-over-year
by Calculated Risk on 6/29/2023 10:04:00 AM
From the NAR: Pending Home Sales Shrunk 2.7% in May
Pending home sales shrunk 2.7% in May from the previous month, according to the National Association of REALTORS®. Three U.S. regions posted monthly losses, while sales in the Northeast surged. All four regions saw year-over-year declines in transactions.This is way below expectations of a 0.3% decrease for this index. Note: Contract signings usually lead sales by about 45 to 60 days, so this would usually be for closed sales in June and July.
“Despite sluggish pending contract signings, the housing market is resilient with approximately three offers for each listing,” said NAR Chief Economist Lawrence Yun, “The lack of housing inventory continues to prevent housing demand from being fully realized.”
The Pending Home Sales Index (PHSI)* – a forward-looking indicator of home sales based on contract signings – dropped 2.7% to 76.5 in May. Year over year, pending transactions fell by 22.2%. An index of 100 is equal to the level of contract activity in 2001.
...
The Northeast PHSI climbed 12.9% from last month to 66.7, a decrease of 21.9% from May 2022. The Midwest index dropped 5.3% to 74.4 in May, down 23.5% from one year ago.
The South PHSI decreased 4.4% to 94.4 in May, reducing 19.6% from the prior year. The West index lessened 6.1% in May to 58.4, falling 26.6% from May 2022.
emphasis added


