by Calculated Risk on 7/04/2023 09:46:00 PM
Tuesday, July 04, 2023
Wednesday: FOMC Minutes
NOTE: The MBA Mortgage Applications Index will be released on Thursday this week due to the holiday.
Wednesday:
• At 2:00 PM ET, FOMC Minutes, Meeting of June 13-14, 2023
Monday, July 03, 2023
Housing Inventory and Demographics: The Next Big Shift
by Calculated Risk on 7/03/2023 02:10:00 PM
Today, in the Calculated Risk Real Estate Newsletter: Housing Inventory and Demographics: The Next Big Shift
A brief excerpt:
In 2021 I wrote Housing and Demographics: The Next Big Shift. In that article I reviewed how demographics had helped me call the apartment boom in the early 2010s, and the home buying boom in 2020.There is much more in the article. You can subscribe at https://calculatedrisk.substack.com/
I also noted:No cohort is monolithic - some people will age-in-place until they pass away, others will move in with family (or family will move in with their parents), and some will move to retirement communities.
There is no magic age that people reach and start to transition, but looking at prior generations, it seems to start when people are around 80 years old.This graph shows the longer term trend for two key age groups: 60 to 79, and 80+.Now the leading edge of the Baby Boom generation is 77. My view is we will see a pickup in downsizing later this decade, but mostly this will be a 2030s story.
This graph is from 2010 to 2060 (all data from Census: current to 2060 is projected).
The leading edge of the Baby Boom generation is currently 75 (born in 1946), and these people will be turning 80 in 2026.
The peak of the boomers will be turning 80 in 2035 or so, and the tail end turning 80 in 2044 (born in 1964).
My sense is there will be a pickup in Boomers selling their homes in the 2nd half of the 2020s and lasting until 2040 or so. These homes will be older - and most will need updating - but many of these homes will be in prime locations.
Construction Spending Increased 0.9% in May
by Calculated Risk on 7/03/2023 10:17:00 AM
From the Census Bureau reported that overall construction spending increased:
Construction spending during May 2023 was estimated at a seasonally adjusted annual rate of $1,925.6 billion, 0.9 percent above the revised April estimate of $1,909.0 billion. The May figure is 2.4 percent above the May 2022 estimate of $1,880.9 billion.Both private and public spending increased:
emphasis added
Spending on private construction was at a seasonally adjusted annual rate of $1,513.2 billion, 1.1 percent above the revised April estimate of $1,497.2 billion. ...
In May, the estimated seasonally adjusted annual rate of public construction spending was $412.4 billion, 0.1 percent above the revised April estimate of $411.8 billion.
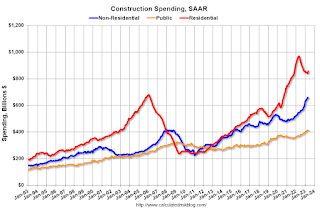 Click on graph for larger image.
This graph shows private residential and nonresidential construction spending, and public spending, since 1993. Note: nominal dollars, not inflation adjusted.
Residential (red) spending is 11.6% below the recent peak.
Non-residential (blue) spending is close to the peak in April 2023.
Public construction spending is at a new peak.
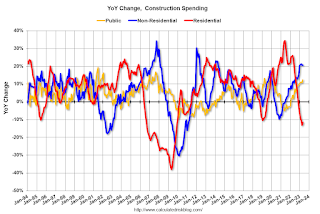 The second graph shows the year-over-year change in construction spending.
On a year-over-year basis, private residential construction spending is down 11.6%. Non-residential spending is up 20.5% year-over-year. Public spending is up 12.3% year-over-year.
ISM® Manufacturing index Decreased to 46.0% in June
by Calculated Risk on 7/03/2023 10:04:00 AM
(Posted with permission). The ISM manufacturing index indicated contraction. The PMI® was at 46.0% in June, down from 46.9% in May. The employment index was at 48.1%, down from 51.4% the previous month, and the new orders index was at 45.6%, up from 42.6%.
From ISM: Manufacturing PMI® at 46%
June 2023 Manufacturing ISM® Report On Business®
Economic activity in the manufacturing sector contracted in June for the eighth consecutive month following a 28-month period of growth, say the nation's supply executives in the latest Manufacturing ISM® Report On Business®.This suggests manufacturing contracted in June. This was below the consensus forecast.
The report was issued today by Timothy R. Fiore, CPSM, C.P.M., Chair of the Institute for Supply Management® (ISM®) Manufacturing Business Survey Committee:
“The June Manufacturing PMI® registered 46 percent, 0.9 percentage point lower than the 46.9 percent recorded in May. Regarding the overall economy, this figure indicates a seventh month of contraction after a 30-month period of expansion. The New Orders Index remained in contraction territory at 45.6 percent, 3 percentage points higher than the figure of 42.6 percent recorded in May. The Production Index reading of 46.7 percent is a 4.4-percentage point decrease compared to May’s figure of 51.1 percent. The Prices Index registered 41.8 percent, down 2.4 percentage points compared to the May figure of 44.2 percent. The Backlog of Orders Index registered 38.7 percent, 1.2 percentage points higher than the May reading of 37.5 percent. The Employment Index dropped into contraction, registering 48.1 percent, down 3.3 percentage points from May’s reading of 51.4 percent.”
emphasis added
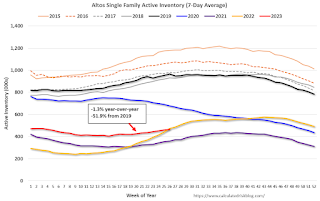
Housing July 3rd Weekly Update: Inventory Increased 1.3% Week-over-week; Down Year-over-year
by Calculated Risk on 7/03/2023 08:21:00 AM
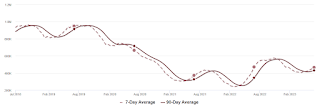 Click on graph for larger image.
This inventory graph is courtesy of Altos Research.
Sunday, July 02, 2023
Sunday Night Futures
by Calculated Risk on 7/02/2023 07:48:00 PM
Weekend:
• Schedule for Week of July 2, 2023
Monday:
• At 10:00 AM ET, ISM Manufacturing Index for June. The consensus is for the ISM to be at 47.2, up from 46.9 in May.
• Also, at 10:00 AM, Construction Spending for May. The consensus is for a 0.5% increase in construction spending.
• Late in the day, Light vehicle sales for June. The consensus is for light vehicle sales to be 15.3 million SAAR in June, up from 15.1 million in May (Seasonally Adjusted Annual Rate). Wards Auto is forecasting sales of 15.9 million SAAR in June.
• US markets will close at 1:00 PM ET prior to the Independence Day Holiday.
From CNBC: Pre-Market Data and Bloomberg futures S&P 500 and DOW futures are unchanged (fair value).
Oil prices were up over the last week with WTI futures at $70.64 per barrel and Brent at $75.41 per barrel. A year ago, WTI was at $110, and Brent was at $119 - so WTI oil prices are down about 36% year-over-year.
Here is a graph from Gasbuddy.com for nationwide gasoline prices. Nationally prices are at $3.50 per gallon. A year ago, prices were at $4.81 per gallon, so gasoline prices are down $1.31 per gallon year-over-year.
Update: Lumber Prices Down About 35% YoY
by Calculated Risk on 7/02/2023 08:21:00 AM
This graph shows CME random length framing futures through May 16th (blue), and the new physically-delivered Lumber Futures (LBR) contract starting in August 2022 (Red).
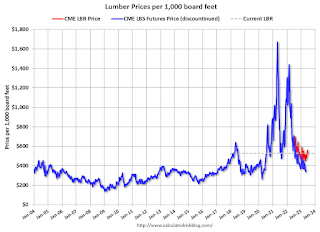 Click on graph for larger image.
We didn't see a significant runup in prices this Spring due to the housing slowdown.
Saturday, July 01, 2023
Real Estate Newsletter Articles this Week: New Home Sales Increase in May
by Calculated Risk on 7/01/2023 02:11:00 PM
At the Calculated Risk Real Estate Newsletter this week:
• New Home Sales increase to 763,000 Annual Rate in May
• Case-Shiller: National House Price Index Decreased 0.2% year-over-year in April
• Inflation Adjusted House Prices 3.8% Below Peak
• Fannie and Freddie Serious Delinquencies in May: Single Family Declined, Multi-Family Increased
• Freddie Mac House Price Index Increased Slightly in May; Up 0.4% Year-over-year
This is usually published 4 to 6 times a week and provides more in-depth analysis of the housing market.
You can subscribe at https://calculatedrisk.substack.com/
Most content is available for free (and no Ads), but please subscribe!
Schedule for Week of July 2, 2023
by Calculated Risk on 7/01/2023 08:11:00 AM
The key report scheduled for this week is the June employment report to be released on Friday.
Other key reports include the June ISM Manufacturing survey, June Vehicle Sales, May Job Openings and the Trade Deficit for May.
10:00 AM: ISM Manufacturing Index for June. The consensus is for the ISM to be at 47.2, up from 46.9 in May.
10:00 AM: Construction Spending for May. The consensus is for a 0.5% increase in construction spending.
 Late in the day: Light vehicle sales for June.
The consensus is for light vehicle sales to be 15.3 million SAAR in June, up from 15.1 million in May (Seasonally Adjusted Annual Rate).
This graph shows light vehicle sales since the BEA started keeping data in 1967. The dashed line is the sales rate for last month.
Wards Auto is forecasting sales of 15.9 million SAAR in June.
US markets will close at 1:00 PM ET prior to the Independence Day Holiday.
All US markets will be closed in observance of Independence Day
8:00 AM: Corelogic House Price index for May.
2:00 PM: FOMC Minutes, Meeting of June 13-14, 2023
7:00 AM ET: The Mortgage Bankers Association (MBA) will release the results for the mortgage purchase applications index.
8:15 AM: The ADP Employment Report for June. This report is for private payrolls only (no government). The consensus is for 236,000 payroll jobs added in June, down from 278,000 in May.
8:30 AM: The initial weekly unemployment claims report will be released. The consensus is for 245 thousand initial claims, up from 239 thousand last week.
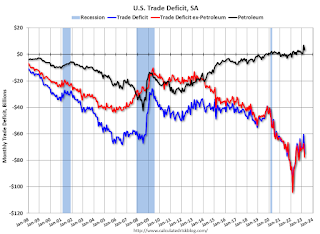 8:30 AM: Trade Balance report for May from the Census Bureau.
 This graph shows the U.S. trade deficit, with and without petroleum, through the most recent report. The blue line is the total deficit, and the black line is the petroleum deficit, and the red line is the trade deficit ex-petroleum products.
The consensus is the trade deficit to be $69.8 billion. The U.S. trade deficit was at $74.6 billion the previous month.
 10:00 AM ET: Job Openings and Labor Turnover Survey for May from the BLS.
 This graph shows job openings (black line), hires (dark blue), Layoff, Discharges and other (red column), and Quits (light blue column) from the JOLTS.
Jobs openings increased in April to 10.1 million from 9.7 million in March.
The number of job openings (yellow) were down 14% year-over-year and quits were down 16% year-over-year.
10:00 AM: the ISM Services Index for June. The consensus is for a reading of 50.5, up from 50.3.
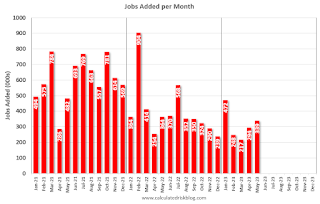 8:30 AM: Employment Report for June. The consensus is for 200,000 jobs added, and for the unemployment rate to be unchanged at 3.7%.
There were 339,000 jobs added in May, and the unemployment rate was at 3.7%.
This graph shows the jobs added per month since January 2021.
Friday, June 30, 2023
June 30th COVID Update: New Pandemic Lows for Deaths and Hospitalizations
by Calculated Risk on 6/30/2023 07:11:00 PM
| COVID Metrics | ||||
|---|---|---|---|---|
| Now | Week Ago | Goal | ||
| Hospitalized2 | 5,758 | 6,233 | ≤3,0001 | |
| Deaths per Week2 | 522 | 624 | ≤3501 | |
| 1my goals to stop weekly posts, 2Weekly for Currently Hospitalized, and Deaths 🚩 Increasing number weekly for Hospitalized and Deaths ✅ Goal met. | ||||
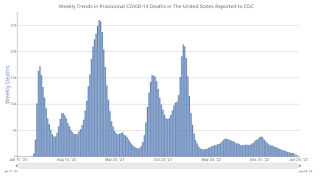 Click on graph for larger image.
This graph shows the weekly (columns) number of deaths reported.


