 RSS Feed
 by Calculated Risk on 7/09/2023 02:12:00 PM
Sunday, July 09, 2023
Hotels: Occupancy Rate Up 4.1% Year-over-year
U.S. hotel performance fell from the previous week, but year-over-year comparisons improved, according to STR‘s latest data through 1 July.The following graph shows the seasonal pattern for the hotel occupancy rate using the four-week average.
25 June through 1 July 2023 (percentage change from comparable week in 2022):
• Occupancy: 69.9% (+4.1%)
• Average daily rate (ADR): US$156.27 (+1.5%)
• Revenue per available room (RevPAR): US$109.18 (+5.7%)
emphasis added
 Click on graph for larger image.
The red line is for 2023, black is 2020, blue is the median, and dashed light blue is for 2022. Dashed purple is for 2018, the record year for hotel occupancy.
The 4-week average of the occupancy rate is at the median rate for the period 2000 through 2022 (Blue).
Note: Y-axis doesn't start at zero to better show the seasonal change.
The 4-week average of the occupancy rate will increase during the summer travel season.
Realtor.com Reports Weekly Active Inventory Down 2% YoY; New Listings Down 21% YoY
by Calculated Risk on 7/09/2023 08:12:00 AM
Realtor.com has monthly and weekly data on the existing home market. Here is their weekly report from economist Danielle Hale: Weekly Housing Trends View — Data Week Ending July 1, 2023
• Active inventory declined, with for-sale homes lagging behind year ago levels by 2%. As we lap the surge in inventory that occurred in 2022 as higher mortgage rates priced out many home shoppers, the number of homes for sale is not keeping up. With 1 in 7 homeowners choosing not to sell this year citing high mortgage rates, and even 4 in 5 home shoppers (82%) report feeling locked-in by their existing low-rate mortgage, the housing market is not getting the influx of homes for sale that it typically does, and this is reflected in what’s available for sale. We expect inventory in 2023 to continue to struggle to keep pace and likely decline for the year as a whole.
• New listings–a measure of sellers putting homes up for sale–were down again this week, by 21% from one year ago. The number of newly listed homes has been lower than the same time the previous year for the past 52 weeks–an entire year. And this week’s data shows a more modest gap than the prior two weeks, but it’s still on par with what has been typical year-to-date. The economy continues to be relatively resilient despite higher interest rates which have dampened homeowner interest in selling. The lack of existing inventory has led to a stronger market for new home sales.
 Here is a graph of the year-over-year change in inventory according to realtor.com.
 Inventory was down 2.1% year-over-year - this was the second consecutive YoY decrease following 58 consecutive weeks with a YoY increase in inventory.
Inventory is still up from the record lows in the 2nd half of 2021 and early 2022, and it is unlikely we will see new record lows this year.
Saturday, July 08, 2023
Real Estate Newsletter Articles this Week: Asking Rent Growth Flat Year-over-year
by Calculated Risk on 7/08/2023 02:11:00 PM
At the Calculated Risk Real Estate Newsletter this week:
• Asking Rent Growth Flat Year-over-year
• Early Look at Local Housing Markets in June
• Housing Inventory and Demographics: The Next Big Shift
This is usually published 4 to 6 times a week and provides more in-depth analysis of the housing market.
You can subscribe at https://calculatedrisk.substack.com/
Most content is available for free (and no Ads), but please subscribe!
Schedule for Week of July 9, 2023
by Calculated Risk on 7/08/2023 08:11:00 AM
The key report this week is June CPI.
No major economic releases scheduled.
6:00 AM ET: NFIB Small Business Optimism Index for June.
8:00 AM: Corelogic House Price index for May.
7:00 AM ET: The Mortgage Bankers Association (MBA) will release the results for the mortgage purchase applications index.
8:30 AM: The Consumer Price Index for June from the BLS. The consensus is for a 0.2% increase in CPI, and a 0.3% increase in core CPI. The consensus is for CPI to be up 3.0% year-over-year and core CPI to be up 5.0% YoY.
2:00 PM: the Federal Reserve Beige Book, an informal review by the Federal Reserve Banks of current economic conditions in their Districts.
8:30 AM: The initial weekly unemployment claims report will be released. The consensus is for 245 thousand initial claims, down from 248 thousand last week.
8:30 AM: The Producer Price Index for June from the BLS. The consensus is for a 0.2% increase in PPI, and a 0.2% increase in core PPI.
10:00 AM: University of Michigan's Consumer sentiment index (Preliminary for July).
Friday, July 07, 2023
July 7th COVID Update: New Pandemic Lows for Deaths and Hospitalizations
by Calculated Risk on 7/07/2023 08:59:00 PM
 Note: Mortgage rates are from MortgageNewsDaily.com and are for top tier scenarios.
Due to changes at the CDC, weekly cases are no longer updated.
After the first few weeks, the pandemic low for weekly deaths had been the week of July 7, 2021, at 1,690 deaths (until recently).
For COVID hospitalizations, the previous low was 9,821 (until recently). NOTE: Hospitalizations were not updated this week.
| COVID Metrics | ||||
|---|---|---|---|---|
| Now | Week Ago | Goal | ||
| Hospitalized2 | 5,758 | 6,233 | ≤3,0001 | |
| Deaths per Week2 | 515 | 568 | ≤3501 | |
| 1my goals to stop weekly posts, 2Weekly for Currently Hospitalized, and Deaths 🚩 Increasing number weekly for Hospitalized and Deaths ✅ Goal met. | ||||
 Click on graph for larger image.
This graph shows the weekly (columns) number of deaths reported.
For deaths, I'm currently using 3 weeks ago for "now", since the most recent two weeks will be revised significantly.
Q2 GDP Tracking: Around 2%
by Calculated Risk on 7/07/2023 05:12:00 PM
From BofA:
Overall, data since our last weekly publication moved down our 2Q GDP tracking estimate from 1.5% q/q saar to 1.4%. [July 7th estimate]From Goldman:
emphasis added
The details of the trade balance report were slightly softer than our previous assumptions, and we lowered our Q2 GDP tracking estimate by one tenth to +2.2% (qoq ar). [July 6th estimate]And from the Altanta Fed: GDPNow
The GDPNow model estimate for real GDP growth (seasonally adjusted annual rate) in the second quarter of 2023 is 2.1 percent on July 6, up from 1.9 percent on July 3. [July 6th estimate]
AAR: June Rail Carloads and Intermodal Decreased Year-over-year
by Calculated Risk on 7/07/2023 03:47:00 PM
From the Association of American Railroads (AAR) Rail Time Indicators. Graphs and excerpts reprinted with permission.
Total originated carloads on U.S. railroads were down 0.2% in June 2023 from June 2022, their first decline in three months. Total carloads in 2023 through June (5.84 million) were up 0.6% (32,547( carloads) over the same period in 2022 and were the highest since 2019.
U.S. intermodal volumes fell again in June — their 7.0% decline from June 2022 was their 16th straight. That said, U.S. railroads originated an average of 247,192 containers and trailers per week in June 2023, the most since October 2022.
emphasis added
 Click on graph for larger image.
This graph from the Rail Time Indicators report shows the six-week average of U.S. Carloads in 2021, 2022 and 2022:
Total originated carloads (which don’t include intermodal) on U.S. railroads in June 2023 were down 0.2% from June 2022, their first decline in three months. In June, 11 of the 20 carload categories we track had carload gains ... Total carloads averaged 225,849 per week in June 2023. Except for December 2022, weekly average total carloads have fluctuated within a relatively narrow band for the past year.
 The second graph shows the six-week average (not monthly) of U.S. intermodal in 2021, 2022 and 2023: (using intermodal or shipping containers):
U.S. intermodal was down 10.3% in Q2 2023 from Q2 2022 (their eighth straight quarterly decline) and also down 10.3% (698,375 units) for the year to date. Volume was 6.11 million units in the first six months of 2023, the fewest for the first six months of a year since 2013.
Intermodal’s decline is a function of a number of factors, including reduced consumer spending on goods, sharply lower port activity, a lack of inventory growth at retailers, and lower truck rates that are making all-truck movements more price competitive vis-à-vis rail intermodal movements.
Heavy Truck Sales Up 15% Year-over-year in June
by Calculated Risk on 7/07/2023 01:31:00 PM
The BEA released their estimate of vehicle sales for June yesterday.
This graph shows heavy truck sales since 1967 using data from the BEA. The dashed line is the June 2023 seasonally adjusted annual sales rate (SAAR).
Heavy truck sales really collapsed during the great recession, falling to a low of 180 thousand SAAR in May 2009. Then heavy truck sales increased to a new all-time high of 570 thousand SAAR in April 2019.
 Click on graph for larger image.
Note: "Heavy trucks - trucks more than 14,000 pounds gross vehicle weight."
Heavy truck sales declined sharply at the beginning of the pandemic, falling to a low of 308 thousand SAAR in May 2020.
Heavy truck sales were at 547 thousand SAAR in June, down from 566 thousand in May, and up 15% from 475 thousand SAAR in June 2022.
Usually, heavy truck sales decline sharply prior to a recession. Sales were strong in June.
Comments on June Employment Report
by Calculated Risk on 7/07/2023 10:23:00 AM
The headline jobs number in the June employment report was at expectations, however, employment for the previous two months was revised down by 110,000, combined. The participation rate and the employment population ratio were unchanged, and the unemployment rate decreased to 3.6%.
Leisure and hospitality gained 21 thousand jobs in June. At the beginning of the pandemic, in March and April of 2020, leisure and hospitality lost 8.2 million jobs, and are now down 369 thousand jobs since February 2020. So, leisure and hospitality has now added back about 96% all of the jobs lost in March and April 2020.
Construction employment increased 20 thousand and is now 339 thousand above the pre-pandemic level.
Manufacturing employment increased 7 thousand jobs and is now 204 thousand above the pre-pandemic level.
In June, the year-over-year employment change was 3.79 million jobs.
Prime (25 to 54 Years Old) Participation
 Since the overall participation rate is impacted by both cyclical (recession) and demographic (aging population, younger people staying in school) reasons, here is the employment-population ratio for the key working age group: 25 to 54 years old.
The 25 to 54 participation rate increased in June to 83.5% from 83.4% in May, and the 25 to 54 employment population ratio increased to 80.9% from 80.7% the previous month.
Both are above the pre-pandemic levels and suggest all of the prime age workers have returned to the labor force.
Average Hourly Wages
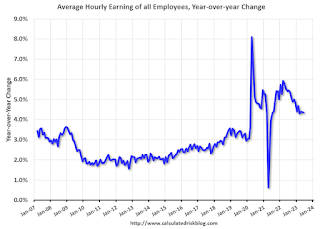 The graph shows the nominal year-over-year change in "Average Hourly Earnings" for all private employees from the Current Employment Statistics (CES).
Average Hourly Wages
 The graph shows the nominal year-over-year change in "Average Hourly Earnings" for all private employees from the Current Employment Statistics (CES).
 There was a huge increase at the beginning of the pandemic as lower paid employees were let go, and then the pandemic related spike reversed a year later.
Wage growth has trended down after peaking at 5.9% YoY in March 2022 and was at 4.4% YoY in June.
Wage growth has trended down after peaking at 5.9% YoY in March 2022 and was at 4.4% YoY in June.
Year-over-year wage growth will likely slow further next month since wage growth was strong in July 2022.
Part Time for Economic Reasons
 From the BLS report:
These workers are included in the alternate measure of labor underutilization (U-6) that increased to 6.9% from 6.7% in the previous month. This is down from the record high in April 22.9% and up from the lowest level on record (seasonally adjusted) in December 2022 (6.5%). (This series started in 1994). This measure is below the 7.0% level in February 2020 (pre-pandemic).
Unemployed over 26 Weeks
 This graph shows the number of workers unemployed for 27 weeks or more.
According to the BLS, there are 1.105 million workers who have been unemployed for more than 26 weeks and still want a job, down from 1.188 million the previous month.
This is at pre-pandemic levels.
Summary:
The headline monthly jobs number was at expectations; however, employment for the previous two months was revised down by 110,000, combined.
Part Time for Economic Reasons
 From the BLS report:
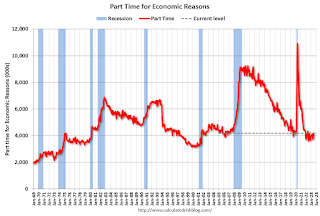
"The number of persons employed part time for economic reasons increased by 452,000 to 4.2 million in June, partially reflecting an increase in the number of persons whose hours were cut due to slack work or business conditions. Persons employed part time for economic reasons are individuals who would have preferred full-time employment but were working part time because their hours had been reduced or they were unable to find full-time jobs."The number of persons working part time for economic reasons increased in June to 4.191 million from 3.739 million in May. This is below pre-recession levels.
These workers are included in the alternate measure of labor underutilization (U-6) that increased to 6.9% from 6.7% in the previous month. This is down from the record high in April 22.9% and up from the lowest level on record (seasonally adjusted) in December 2022 (6.5%). (This series started in 1994). This measure is below the 7.0% level in February 2020 (pre-pandemic).
Unemployed over 26 Weeks
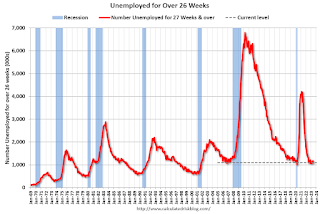
 This graph shows the number of workers unemployed for 27 weeks or more.
 According to the BLS, there are 1.105 million workers who have been unemployed for more than 26 weeks and still want a job, down from 1.188 million the previous month.
This is at pre-pandemic levels.
Summary:
The headline monthly jobs number was at expectations; however, employment for the previous two months was revised down by 110,000, combined.
Overall, this was a solid employment report.
June Employment Report: 209 thousand Jobs, 3.6% Unemployment Rate
by Calculated Risk on 7/07/2023 08:40:00 AM
From the BLS:
Total nonfarm payroll employment increased by 209,000 in June, and the unemployment rate changed little at 3.6 percent, the U.S. Bureau of Labor Statistics reported today. Employment continued to trend up in government, health care, social assistance, and construction.
...
The change in total nonfarm payroll employment for April was revised down by 77,000, from +294,000 to +217,000, and the change for May was revised down by 33,000, from +339,000 to +306,000. With these revisions, employment in April and May combined is 110,000 lower than previously reported.
emphasis added
 Click on graph for larger image.
The first graph shows the jobs added per month since January 2021.
Total payrolls increased by 209 thousand in June. Private payrolls increased by 149 thousand, and public payrolls increased 60 thousand.
Payrolls for April and May were revised down 110 thousand, combined.
Payrolls for April and May were revised down 110 thousand, combined.
 The second graph shows the year-over-year change in total non-farm employment since 1968.
In June, the year-over-year change was 3.79 million jobs. Employment was up significantly year-over-year.
The third graph shows the employment population ratio and the participation rate.
 The Labor Force Participation Rate was unchanged at 62.6% in June, from 62.6% in May. This is the percentage of the working age population in the labor force.
 The Employment-Population ratio was unchanged at 60.3% from 60.3% (blue line).
I'll post the 25 to 54 age group employment-population ratio graph later.
 The fourth graph shows the unemployment rate.
 The unemployment rate decreased in June to 3.6% from 3.7% in May.
This was at consensus expectations; however, April and May payrolls were revised down by 110,000 combined.


