by Calculated Risk on 7/10/2023 05:42:00 PM
Monday, July 10, 2023
Second Home Market: South Lake Tahoe in June; Prices Down 6.8% YoY
With the pandemic, there was a surge in 2nd home buying.
I'm looking at data for some second home markets - and I'm tracking those markets to see if there is an impact from lending changes, rising mortgage rates or the easing of the pandemic.
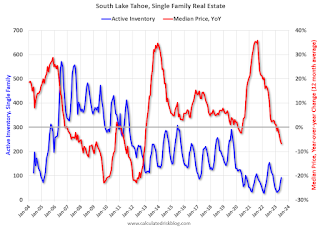
This graph is for South Lake Tahoe since 2004 through June 2023, and shows inventory (blue), and the year-over-year (YoY) change in the median price (12-month average).
Note: The median price is a 12-month average, and is distorted by the mix, but this is the available data.

Following the housing bubble, prices declined for several years in South Lake Tahoe, with the median price falling about 50% from the bubble peak.
Currently active inventory is still very low and is down 35% year-over-year.
Lawler: Update on Demographic Trends, and Population and Household Projections Through 2025
by Calculated Risk on 7/10/2023 01:35:00 PM
Today, in the Calculated Risk Real Estate Newsletter: Lawler: Update on Demographic Trends, and Population and Household Projections Through 2025
A brief excerpt:
Executive Summary: Higher Net International Migration (NIM) and lower deaths have improved the US “demographic” outlook, though population growth from 2022 to 2025 will still be historically on the low side – in part because of continued very low birth rates. Household growth, on the other hand, will likely be materially slower than the apparent very rapid growth following the pandemic, and will probably not be that different from the annual average growth experienced last decade.There is much more in the article. You can subscribe at https://calculatedrisk.substack.com/
The Census Bureau’s “Vintage 2022” population estimates suggested that the US resident population increased by 0.38% from July 1, 2021 to July 1, 2022, very low by historical standards but up from the 0.16% from the previous year. The uptick in growth reflected a modest increase in the number of births (from very low level) and a significant increase in estimate net international migration (from very low levels), offset by a slight increase in the number of deaths. (Note that CDC data suggest that the Vintage 2022 estimates for deaths over the 12-month period ending 6/20/2022 is understated by almost 20,000.).
Available data since July 1, 2022 suggest that (1) births over the 12-month period ending July 1, 2023 will probably be down very slightly from the year ago 12-month period; (2) deaths will be significantly lower over the 12-month period ending July 1, 2023 compared to the year ago 12-month period, mainly reflecting substantial declines in Covid related deaths; and (3) net international migration over the 12-month period ending July 1, 2023 should be higher than the year ago 12-month period.
...Translating all of this information into actual and projected household growth, however, is challenging given the lack of actual and timely historical data. Based on the limited data available, below are my “guesstimates” for household growth from 2020 to 2023, as well as my projections through 2025. In terms of headship rates, I assumed that headship rates by age gradually declined from 2022 to 2025, but that over that period the “reversal” in headship gains was only 30%. (Yes, I am aware that is arbitrary.). Also shown are what household growth would have been if headship rates by age had been unchanged from 2020 (I used Decennial Census data to derive 2020 headship rates, though that data may have issues.)
emphasis added
Black Knight Mortgage Monitor: Home Prices Increased Month-to-month to New Record High in May
by Calculated Risk on 7/10/2023 10:47:00 AM
Today, in the Calculated Risk Real Estate Newsletter: Black Knight Mortgage Monitor: Home Prices Increased Month-to-month to New Record High in May
A brief excerpt:
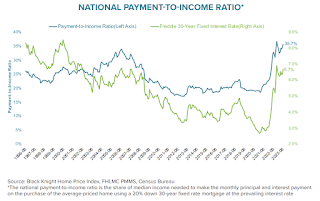
National Payment to Income Ratio Increased to Near RecordThere is much more in the article. You can subscribe at https://calculatedrisk.substack.com/
This was as of June 22nd when mortgage rates (according to the Freddie Mac PMMS), were at 6.67%. Rates have increased since then, and it is likely the payment-to-income ratio is now at a new record high.
Black Knight on the payment to income ratio:
• After a modest improvement in early 2023, home affordability has worsened in recent months fueled by both rising home prices and rising interest rates
• As of June 22, with 30-year rates at 6.67%, it required $2,258 per month in principal and interest to make the monthly payment on a median-priced home with 20% down and a 30-year mortgage, the highest such payment on record, marginally higher than the $2,234 required back in October
• Factoring in current income levels, that means 35.7% of the median household income would need to be allocated to the monthly payment of a median-priced home, making June the second least affordable month in the past 37 years
emphasis added
Wholesale Used Car Prices Decreased 4.2% in June; Down 10.3% Year-over-year
by Calculated Risk on 7/10/2023 09:55:00 AM
From Manheim Consulting today: Wholesale Used-Vehicle Prices See Large Decline in June
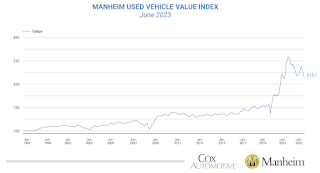
Wholesale used-vehicle prices (on a mix, mileage, and seasonally adjusted basis) decreased 4.2% in June from May. The Manheim Used Vehicle Value Index (MUVVI) declined to 215.1, down 10.3% from a year ago.
“The 4.2% drop is among the largest declines in MUVVI history and the largest decline since the start of the pandemic in April 2020 when the index plunged 11.4%,” said Chris Frey, senior manager of Economic and Industry Insights for Cox Automotive. “The year-over-year decline was also large, another 2.7% drop from May’s annualized 7.6% decline, but as mentioned last month, auction prices were lower in the fall last year, and we expect these increasing year-over-year moves to shrink in the months ahead as the market normalizes.
emphasis added
 Click on graph for larger image.
This index from Manheim Consulting is based on all completed sales transactions at Manheim’s U.S. auctions.
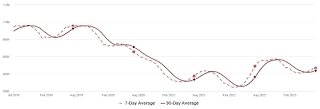
Housing July 10th Weekly Update: Inventory Decreased 0.2% Week-over-week; Down 4.6% Year-over-year
by Calculated Risk on 7/10/2023 08:21:00 AM
 Click on graph for larger image.
This inventory graph is courtesy of Altos Research.

Sunday, July 09, 2023
Sunday Night Futures
by Calculated Risk on 7/09/2023 08:50:00 PM
• Schedule for Week of July 9, 2023
Monday:
• No major economic releases scheduled.
From CNBC: Pre-Market Data and Bloomberg futures S&P 500 and DOW futures are down slightly (fair value).
Oil prices were up over the last week with WTI futures at $73.51 per barrel and Brent at $78.13 per barrel. A year ago, WTI was at $107, and Brent was at $114 - so WTI oil prices are down about 30% year-over-year.
Here is a graph from Gasbuddy.com for nationwide gasoline prices. Nationally prices are at $3.50 per gallon. A year ago, prices were at $4.68 per gallon, so gasoline prices are down $1.18 per gallon year-over-year.
Hotels: Occupancy Rate Up 4.1% Year-over-year
by Calculated Risk on 7/09/2023 02:12:00 PM
U.S. hotel performance fell from the previous week, but year-over-year comparisons improved, according to STR‘s latest data through 1 July.The following graph shows the seasonal pattern for the hotel occupancy rate using the four-week average.
25 June through 1 July 2023 (percentage change from comparable week in 2022):
• Occupancy: 69.9% (+4.1%)
• Average daily rate (ADR): US$156.27 (+1.5%)
• Revenue per available room (RevPAR): US$109.18 (+5.7%)
emphasis added
 Click on graph for larger image.
The red line is for 2023, black is 2020, blue is the median, and dashed light blue is for 2022. Dashed purple is for 2018, the record year for hotel occupancy.
Realtor.com Reports Weekly Active Inventory Down 2% YoY; New Listings Down 21% YoY
by Calculated Risk on 7/09/2023 08:12:00 AM
Realtor.com has monthly and weekly data on the existing home market. Here is their weekly report from economist Danielle Hale: Weekly Housing Trends View — Data Week Ending July 1, 2023
• Active inventory declined, with for-sale homes lagging behind year ago levels by 2%. As we lap the surge in inventory that occurred in 2022 as higher mortgage rates priced out many home shoppers, the number of homes for sale is not keeping up. With 1 in 7 homeowners choosing not to sell this year citing high mortgage rates, and even 4 in 5 home shoppers (82%) report feeling locked-in by their existing low-rate mortgage, the housing market is not getting the influx of homes for sale that it typically does, and this is reflected in what’s available for sale. We expect inventory in 2023 to continue to struggle to keep pace and likely decline for the year as a whole.
• New listings–a measure of sellers putting homes up for sale–were down again this week, by 21% from one year ago. The number of newly listed homes has been lower than the same time the previous year for the past 52 weeks–an entire year. And this week’s data shows a more modest gap than the prior two weeks, but it’s still on par with what has been typical year-to-date. The economy continues to be relatively resilient despite higher interest rates which have dampened homeowner interest in selling. The lack of existing inventory has led to a stronger market for new home sales.
 Here is a graph of the year-over-year change in inventory according to realtor.com.
 Inventory was down 2.1% year-over-year - this was the second consecutive YoY decrease following 58 consecutive weeks with a YoY increase in inventory.
Saturday, July 08, 2023
Real Estate Newsletter Articles this Week: Asking Rent Growth Flat Year-over-year
by Calculated Risk on 7/08/2023 02:11:00 PM
At the Calculated Risk Real Estate Newsletter this week:
• Asking Rent Growth Flat Year-over-year
• Early Look at Local Housing Markets in June
• Housing Inventory and Demographics: The Next Big Shift
This is usually published 4 to 6 times a week and provides more in-depth analysis of the housing market.
You can subscribe at https://calculatedrisk.substack.com/
Most content is available for free (and no Ads), but please subscribe!
Schedule for Week of July 9, 2023
by Calculated Risk on 7/08/2023 08:11:00 AM
The key report this week is June CPI.
No major economic releases scheduled.
6:00 AM ET: NFIB Small Business Optimism Index for June.
8:00 AM: Corelogic House Price index for May.
7:00 AM ET: The Mortgage Bankers Association (MBA) will release the results for the mortgage purchase applications index.
8:30 AM: The Consumer Price Index for June from the BLS. The consensus is for a 0.2% increase in CPI, and a 0.3% increase in core CPI. The consensus is for CPI to be up 3.0% year-over-year and core CPI to be up 5.0% YoY.
2:00 PM: the Federal Reserve Beige Book, an informal review by the Federal Reserve Banks of current economic conditions in their Districts.
8:30 AM: The initial weekly unemployment claims report will be released. The consensus is for 245 thousand initial claims, down from 248 thousand last week.
8:30 AM: The Producer Price Index for June from the BLS. The consensus is for a 0.2% increase in PPI, and a 0.2% increase in core PPI.
10:00 AM: University of Michigan's Consumer sentiment index (Preliminary for July).


