 RSS Feed
 by Calculated Risk on 7/13/2023 08:34:00 AM
Thursday, July 13, 2023
Weekly Initial Unemployment Claims Decrease to 237,000
The DOL reported:
In the week ending July 8, the advance figure for seasonally adjusted initial claims was 237,000, a decrease of 12,000 from the previous week's revised level. The previous week's level was revised up by 1,000 from 248,000 to 249,000. The 4-week moving average was 246,750, a decrease of 6,750 from the previous week's revised average. The previous week's average was revised up by 250 from 253,250 to 253,500.The following graph shows the 4-week moving average of weekly claims since 1971.
emphasis added
 Click on graph for larger image.
The dashed line on the graph is the current 4-week average. The four-week average of weekly unemployment claims decreased to 246,750.
The previous week was revised up.
Weekly claims were below the consensus forecast.
Wednesday, July 12, 2023
Thursday: Unemployment Claims, PPI
by Calculated Risk on 7/12/2023 08:50:00 PM
 Note: Mortgage rates are from MortgageNewsDaily.com and are for top tier scenarios.
The better-than-expected inflation data today pushed down mortgage rates.
Thursday:
• At 8:30 AM ET, the initial weekly unemployment claims report will be released. The consensus is for 245 thousand initial claims, down from 248 thousand last week.
• At 8:30 AM, The Producer Price Index for June from the BLS. The consensus is for a 0.2% increase in PPI, and a 0.2% increase in core PPI.
Part 1: Current State of the Housing Market; Overview for mid-July
by Calculated Risk on 7/12/2023 05:54:00 PM
Today, in the Calculated Risk Real Estate Newsletter: Part 1: Current State of the Housing Market; Overview for mid-July
A brief excerpt:
Interestingly, new home inventory is close to a record percentage of total inventory. This graph uses Not Seasonally Adjusted (NSA) existing home inventory from the National Association of Realtors® (NAR) and new home inventory from the Census Bureau (only completed and under construction inventory).There is much more in the article. You can subscribe at https://calculatedrisk.substack.com/
Note: Mark Fleming, Chief Economist at First American pointed this out in March.
It took a number of years following the housing bust for new home inventory to return to the pre-bubble percent of total inventory. Then, with the pandemic, existing home inventory collapsed and now the percent of new homes is close to 23% of total for sale inventory. The lack of existing home inventory, and few distressed sales, has been a positive for homebuilders.

Fed's Beige Book: "Overall economic activity increased slightly"
by Calculated Risk on 7/12/2023 05:17:00 PM
Fed's Beige Book "This report was prepared at the Federal Reserve Bank of Minneapolis based on information collected on or before June 30, 2023."
Overall economic activity increased slightly since late May. Five Districts reported slight or modest growth, five noted no change, and two reported slight and modest declines. Reports on consumer spending were mixed; growth was generally observed in consumer services, but some retailers noted shifts away from discretionary spending. Tourism and travel activity was robust, and hospitality contacts expected a busy summer season. Auto sales remained unchanged or exhibited moderate growth across most Districts. Manufacturing activity edged up in half of the Districts and declined in the other half. Transportation activity was down or flat in most Districts that reported on it, as some contacts reported reduced demand due to high inventory levels and others noted continued challenges from labor shortages. Banking conditions were mostly subdued, as lending activity continued to soften. Despite higher mortgage rates, demand for residential real estate remained steady, although sales were constrained by low inventories. Construction for both residential and commercial units was slightly lower on balance. Agricultural conditions were mixed geographically but softened slightly on balance, with some contacts expecting further softening for the remainder of 2023. Energy activity decreased. Overall economic expectations for the coming months generally continued to call for slow growth.
Employment increased modestly this period, with most Districts experiencing some job growth. Labor demand remained healthy, though some contacts reported that hiring was getting more targeted and selective. Employers continued to have difficulty finding workers, particularly in health care, transportation, and hospitality, and for high-skilled positions in general. However, many Districts reported that labor availability had improved and that some employers were having an easier time hiring than they were having previously. Employers also reported that the unusually high turnover rates in recent years appear to be returning to pre-pandemic norms. Wages continued to rise, but more moderately. Contacts in multiple Districts reported that wage increases were returning to or nearing pre-pandemic levels.
emphasis added
Early Look at 2024 Cost-Of-Living Adjustments and Maximum Contribution Base
by Calculated Risk on 7/12/2023 03:47:00 PM
The BLS reported this morning:
The Consumer Price Index for Urban Wage Earners and Clerical Workers (CPI-W) increased 2.3 percent over the last 12 months to an index level of 299.394 (1982-84=100). For the month, the index increased 0.3 percent prior to seasonal adjustment.CPI-W is the index that is used to calculate the Cost-Of-Living Adjustments (COLA). The calculation dates have changed over time (see Cost-of-Living Adjustments), but the current calculation uses the average CPI-W for the three months in Q3 (July, August, September) and compares to the average for the highest previous average of Q3 months. Note: this is not the headline CPI-U and is not seasonally adjusted (NSA).
• In 2022, the Q3 average of CPI-W was 291.901.
The 2022 Q3 average was the highest Q3 average, so we only have to compare Q3 this year to last year.
 Click on graph for larger image.
This graph shows CPI-W since January 2000. The red lines are the Q3 average of CPI-W for each year.
Note: The year labeled is for the calculation, and the adjustment is effective for December of that year (received by beneficiaries in January of the following year).
CPI-W was up 2.3% year-over-year in June, and although this is early - we need the data for July, August and September - my very early guess is COLA will probably be close to 3% this year, the smallest increase since 1.3% in 2021.
Note that CPI-W was slightly negative month-over-month in July and August of 2022, so it is likely there will be a larger year-over-year increase in CPI-W over the next few months than in June, hence my 3% early guess.
Contribution and Benefit Base
The contribution base will be adjusted using the National Average Wage Index. This is based on a one-year lag. The National Average Wage Index is not available for 2022 yet, wages increased solidly in 2022. If wages increased 5% in 2022, then the contribution base next year will increase to around $168,200 in 2024, from the current $160,200.
Remember - this is an early look. What matters is average CPI-W, NSA, for all three months in Q3 (July, August and September).
Cleveland Fed: Median CPI increased 0.1% and Trimmed-mean CPI increased 0.1% in June
by Calculated Risk on 7/12/2023 01:06:00 PM
The Cleveland Fed released the median CPI and the trimmed-mean CPI.
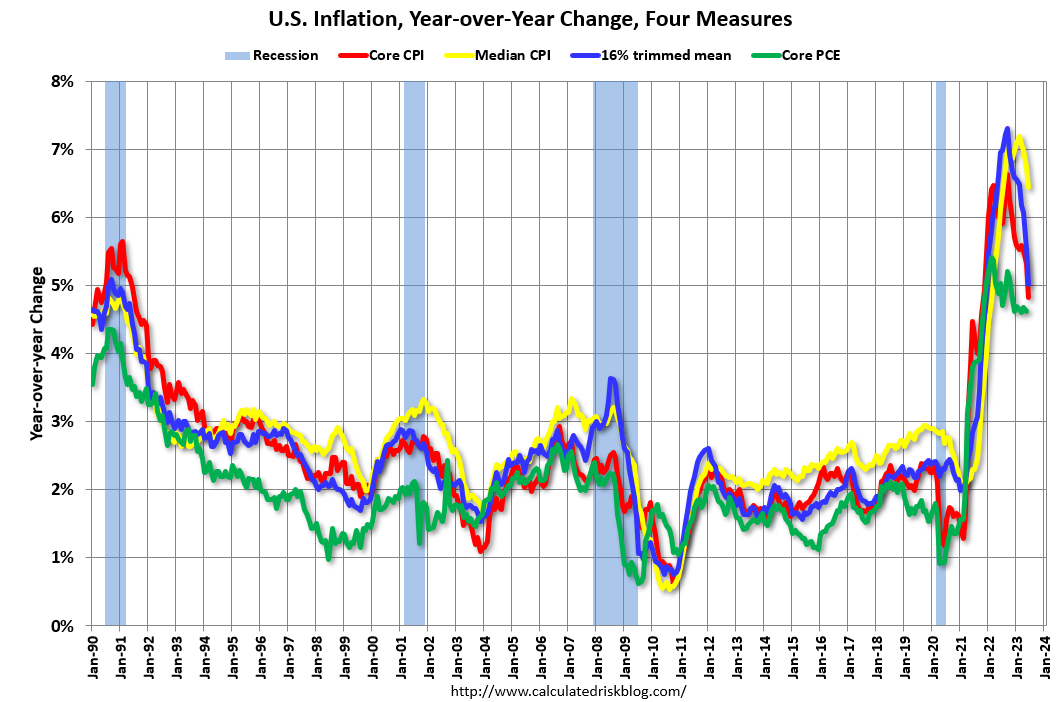
According to the Federal Reserve Bank of Cleveland, the median Consumer Price Index rose 0.1% in June. The 16% trimmed-mean Consumer Price Index also increased 0.1% in June. "The median CPI and 16% trimmed-mean CPI are measures of core inflation calculated by the Federal Reserve Bank of Cleveland based on data released in the Bureau of Labor Statistics’ (BLS) monthly CPI report".
 Click on graph for larger image.
This graph shows the year-over-year change for these four key measures of inflation.
On a year-over-year basis, the median CPI rose 6.4%, the trimmed-mean CPI rose 5.5%, and the CPI less food and energy rose 5.0%. Core PCE is for May and increased 4.6% year-over-year.
Note: The Cleveland Fed released the median CPI details. "Motor Vehicle Insurance" increased at a 21% annualized rate in June.
YoY Measures of Inflation: Services, Goods and Shelter
by Calculated Risk on 7/12/2023 08:59:00 AM
Here are a few measures of inflation:
The first graph is the one Fed Chair Powell had been mentioning when services less rent of shelter was up 7.6% year-over-year. This has fallen sharply and is now up 3.2% YoY.
 Click on graph for larger image.
This graph shows the YoY price change for Services and Services less rent of shelter through June 2023.
Services were up 5.7% YoY as of June 2023, down from 6.3% YoY in May.
Services less rent of shelter was up 3.2% YoY in June, down from 4.2% YoY in May.
Services less rent of shelter was up 3.2% YoY in June, down from 4.2% YoY in May.
Will services ex-shelter inflation be persistent, or will it follow a similar pattern as goods? This is a topic I discussed in Pandemic Economics, Housing and Monetary Policy: Part 2.
 The second graph shows that goods prices started to increase year-over-year (YoY) in 2020 and accelerated in 2021 due to both strong demand and supply chain disruptions.
 The second graph shows that goods prices started to increase year-over-year (YoY) in 2020 and accelerated in 2021 due to both strong demand and supply chain disruptions.
Durables were at -0.8% YoY as of June 2023, down from 0.0% YoY in May.
Commodities less food and energy commodities were up 1.4% YoY in June, down from 2.0% YoY in May.
Commodities less food and energy commodities were up 1.4% YoY in June, down from 2.0% YoY in May.
Goods inflation was transitory.
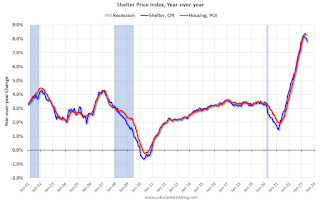 Here is a graph of the year-over-year change in shelter from the CPI report (through June) and housing from the PCE report (through May 2023)
Shelter was up 7.8% year-over-year in June, down from 8.0% in May. Housing (PCE) was up 8.3% YoY in May, down from 8.4% in April.
The BLS noted this morning: "The index for shelter was the largest contributor to the monthly all items increase, accounting for over 70 percent of the increase, with the index for motor vehicle insurance also contributing." Asking rent increases have slowed sharply, and these measures of shelter will continue to decline.
BLS: CPI increased 0.2% in June; Core CPI increased 0.2%
by Calculated Risk on 7/12/2023 08:30:00 AM
The Consumer Price Index for All Urban Consumers (CPI-U) rose 0.2 percent in June on a seasonally adjusted basis, after increasing 0.1 percent in May, the U.S. Bureau of Labor Statistics reported today. Over the last 12 months, the all items index increased 3.0 percent before seasonal adjustment.CPI was as expectations and core CPI was lower than expected. I'll post a graph later today after the Cleveland Fed releases the median and trimmed-mean CPI.
The index for shelter was the largest contributor to the monthly all items increase, accounting for over 70 percent of the increase, with the index for motor vehicle insurance also contributing. The food index increased 0.1 percent in June after increasing 0.2 percent the previous month. The index for food at home was unchanged over the month while the index for food away from home rose 0.4 percent in June. The energy index rose 0.6 percent in June as the major energy component indexes were mixed.
The index for all items less food and energy rose 0.2 percent in June, the smallest 1-month increase in that index since August 2021. Indexes which increased in June include shelter, motor vehicle insurance, apparel, recreation, and personal care. The indexes for airline fares, communication, used cars and trucks, and household furnishings and operations were among those that decreased over the month.
The all items index increased 3.0 percent for the 12 months ending June; this was the smallest 12-month increase since the period ending March 2021. The all items less food and energy index rose 4.8 percent over the last 12 months. The energy index decreased 16.7 percent for the 12 months ending June, and the food index increased 5.7 percent over the last year.
emphasis added
MBA: Mortgage Applications Increased in Weekly Survey
by Calculated Risk on 7/12/2023 07:00:00 AM
From the MBA: Mortgage Applications Increase in Latest MBA Weekly Survey
Mortgage applications increased 0.9 percent from one week earlier, according to data from the Mortgage Bankers Association’s (MBA) Weekly Mortgage Applications Survey for the week ending July 7, 2023. This week’s results include an adjustment for the observance of Independence Day.
The Market Composite Index, a measure of mortgage loan application volume, increased 0.9 percent on a seasonally adjusted basis from one week earlier. On an unadjusted basis, the Index decreased 19 percent compared with the previous week. The Refinance Index decreased 1 percent from the previous week and was 39 percent lower than the same week one year ago. The seasonally adjusted Purchase Index increased 2 percent from one week earlier. The unadjusted Purchase Index decreased 19 percent compared with the previous week and was 26 percent lower than the same week one year ago.
“Incoming economic data continue to send mixed signals about the economy, with the overall impact leaving Treasury yields higher last week as markets expect that the Federal Reserve will need to hold rates higher for longer to slow inflation. All mortgage rates in our survey followed suit, with the 30-year fixed rate increasing to 7.07 percent, the highest level since November 2022,” said Joel Kan, MBA’s Vice President and Deputy Chief Economist. “The jumbo rate also increased to 7.04 percent, a record high for the jumbo series, which dates back to 2011.”
Added Kan, “Purchase applications increased, but remained at a very low level and are 26 percent lower than the same week last year. The rise in purchase activity was driven by increases in both FHA and VA purchase applications. The refinance index dropped to its lowest level since early June, as demand for rate/term and cash-out refinances remains extremely low with mortgage rates over 7 percent.”
...
The average contract interest rate for 30-year fixed-rate mortgages with conforming loan balances ($726,200 or less) increased to 7.07 percent from 6.85 percent, with points increasing to 0.74 from 0.65 (including the origination fee) for 80 percent loan-to-value ratio (LTV) loans. The effective rate increased from last week.
emphasis added
 Click on graph for larger image.
The first graph shows the MBA mortgage purchase index.
According to the MBA, purchase activity is down 26% year-over-year unadjusted.
Red is a four-week average (blue is weekly). This is close to the lowest level since the mid-'90s!

The second graph shows the refinance index since 1990.
With higher mortgage rates, the refinance index declined sharply in 2022 - and has mostly flat lined at a low level since then.
Tuesday, July 11, 2023
Wednesday: CPI, Beige Book
by Calculated Risk on 7/11/2023 08:41:00 PM
 Note: Mortgage rates are from MortgageNewsDaily.com and are for top tier scenarios.
Wednesday:
• At 7:00 AM ET, The Mortgage Bankers Association (MBA) will release the results for the mortgage purchase applications index.
• At 8:30 AM, The Consumer Price Index for June from the BLS. The consensus is for a 0.2% increase in CPI, and a 0.3% increase in core CPI. The consensus is for CPI to be up 3.0% year-over-year and core CPI to be up 5.0% YoY.
• At 2:00 PM, the Federal Reserve Beige Book, an informal review by the Federal Reserve Banks of current economic conditions in their Districts.


