by Calculated Risk on 7/19/2023 08:37:00 AM
Wednesday, July 19, 2023
Housing Starts Decreased Sharply to 1.434 million Annual Rate in June
From the Census Bureau: Permits, Starts and Completions
Housing Starts:
Privately‐owned housing starts in June were at a seasonally adjusted annual rate of 1,434,000. This is 8.0 percent below the revised May estimate of 1,559,000 and is 8.1 percent below the June 2022 rate of 1,561,000. Single‐family housing starts in June were at a rate of 935,000; this is 7.0 percent below the revised May figure of 1,005,000. The June rate for units in buildings with five units or more was 482,000.
Building Permits:
Privately‐owned housing units authorized by building permits in June were at a seasonally adjusted annual rate of 1,440,000. This is 3.7 percent below the revised May rate of 1,496,000 and is 15.3 percent below the June 2022 rate of 1,701,000. Single‐family authorizations in June were at a rate of 922,000; this is 2.2 percent above the revised May figure of 902,000. Authorizations of units in buildings with five units or more were at a rate of 467,000 in June.
emphasis added
 Click on graph for larger image.
The first graph shows single and multi-family housing starts for the last several years.
Multi-family starts (blue, 2+ units) decreased in June compared to May. Multi-family starts were down 9.4% year-over-year in June.
Single-family starts (red) decreased in June and were down 7.4% year-over-year.
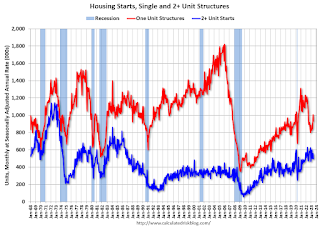 The second graph shows single and multi-family housing starts since 1968.
 This shows the huge collapse following the housing bubble, and then the eventual recovery - and the recent collapse in single-family starts.
Total housing starts in June were below expectations, and starts in April and May were revised down, combined.
I'll have more later …
MBA: Mortgage Applications Increased in Weekly Survey
by Calculated Risk on 7/19/2023 07:00:00 AM
From the MBA: Mortgage Applications Increase in Latest MBA Weekly Survey
Mortgage applications increased 1.1 percent from one week earlier, according to data from the Mortgage Bankers Association’s (MBA) Weekly Mortgage Applications Survey for the week ending July 14, 2023. Last week’s results included an adjustment for Independence Day.
The Market Composite Index, a measure of mortgage loan application volume, increased 1.1 percent on a seasonally adjusted basis from one week earlier. On an unadjusted basis, the Index increased 27 percent compared with the previous week. The Refinance Index increased 7 percent from the previous week and was 32 percent lower than the same week one year ago. The seasonally adjusted Purchase Index decreased 1 percent from one week earlier. The unadjusted Purchase Index increased 24 percent compared with the previous week and was 21 percent lower than the same week one year ago.
“Mortgage rates declined last week, as markets responded positively to incoming data showing that U.S. inflation continues to cool. Most rates in our survey declined, with the 30-year fixed rate falling to 6.87 percent,” said Joel Kan, MBA’s Vice President and Deputy Chief Economist. “Refinance applications increased more than 7 percent, but that activity accounted for only 28 percent of applications and was more than 30 percent behind last year’s pace. Despite last week’s lower rates, purchase applications decreased, as home purchase activity is still being held back by low housing supply and rates that are still much higher than a year ago.”
...
The average contract interest rate for 30-year fixed-rate mortgages with conforming loan balances ($726,200 or less) decreased to 6.87 percent from 7.07 percent, with points decreasing to 0.66 from 0.74 (including the origination fee) for 80 percent loan-to-value ratio (LTV) loans.
emphasis added
 Click on graph for larger image.
The first graph shows the MBA mortgage purchase index.
According to the MBA, purchase activity is down 21% year-over-year unadjusted.

Tuesday, July 18, 2023
Wednesday: Housing Starts
by Calculated Risk on 7/18/2023 08:33:00 PM
Wednesday:
• At 7:00 AM ET, The Mortgage Bankers Association (MBA) will release the results for the mortgage purchase applications index.
• At 8:30 AM, Housing Starts for June. The consensus is for 1.450 million SAAR, down from 1.631 million SAAR in May.
• During the day: The AIA's Architecture Billings Index for June (a leading indicator for commercial real estate).
NMHC: "Apartment Market Continues to Loosen"
by Calculated Risk on 7/18/2023 02:50:00 PM
Today, in the Calculated Risk Real Estate Newsletter: NMHC: "Apartment Market Continues to Loosen"
A brief excerpt:
Apartment market conditions continued to weaken in the National Multifamily Housing Council’s (NMHC’s) Quarterly Survey of Apartment Market Conditions for July 2023, as the Market Tightness (26), Sales Volume (40), Equity Financing (22) and Debt Financing (18) indexes all came in well below the breakeven level (50).There is more in the article. You can subscribe at https://calculatedrisk.substack.com/
...
• The Market Tightness Index came in at 26 this quarter – below the breakeven level (50) – indicating looser market conditions for the fourth consecutive quarter. More than half of respondents (57%) reported markets to be looser than three months ago, while only 9% thought markets have become tighter. Meanwhile, around a third of respondents (34%) thought that market conditions were unchanged over the past three months.
NAHB: Builder Confidence Increased in July
by Calculated Risk on 7/18/2023 10:00:00 AM
The National Association of Home Builders (NAHB) reported the housing market index (HMI) was at 56, up from 55 last month. Any number above 50 indicates that more builders view sales conditions as good than poor.
From the NAHB: Builder Confidence Edges Higher Despite Rising Rate Concerns
Low existing inventory that is keeping demand solid for new homes helped to push builder confidence up in July even as the industry continues to grapple with rising mortgage rates, elevated construction costs and limited lot availability.
Builder confidence in the market for newly built single-family homes in July posted a one-point gain to 56, according to the National Association of Home Builders (NAHB)/Wells Fargo Housing Market Index (HMI). This is the seventh straight month that builder confidence has increased and marks the highest level since June of last year.
The lack of resale inventory means prospective home buyers who have not been priced out of the market continue to seek out new construction in greater numbers. At the same time, builders are troubled over rising mortgage rates approaching 7% and continue to grapple with supply-side challenges, including ongoing scarcity of electrical transformer equipment and growing concerns about lot availability.
...
The July HMI survey also revealed that despite elevated interest rates, builders’ use of sales incentives has declined, as the market has firmed and resale inventory options remain limited. Only 22% of builders report cutting prices in July. This is down from 25% in June and 27% in May.
...
The HMI index gauging current sales conditions in July rose one point to 62, the component charting sales expectations in the next six months fell two points to 60, and the gauge measuring traffic of prospective buyers increased three points to 40, the highest reading since June of last year. However, the decline for the future sales expectation reading is a reminder that housing affordability continues to be challenged by elevated interest rates.
Looking at the three-month moving averages for regional HMI scores, the Northeast increased five points to 52, the Midwest edged up two points to 45, the South increased three points to 58 and the West posted a five-point gain to 51.
emphasis added
 Click on graph for larger image.
This graph shows the NAHB index since Jan 1985.
This was slightly above the consensus forecast.
Industrial Production Decreased 0.5% in June
by Calculated Risk on 7/18/2023 09:15:00 AM
From the Fed: Industrial Production and Capacity Utilization
Industrial production declined 0.5 percent in June for a second consecutive month but advanced 0.7 percent at an annual rate for the second quarter as a whole. Manufacturing output moved down 0.3 percent in June but rose 1.5 percent in the second quarter. In June, the indexes for mining and utilities fell 0.2 percent and 2.6 percent, respectively. At 102.2 percent of its 2017 average, total industrial production in June was 0.4 percent below its year-earlier level. Capacity utilization stepped down to 78.9 percent in June, a rate that is 0.8 percentage point below its long-run (1972–2022) average.
emphasis added
 Click on graph for larger image.
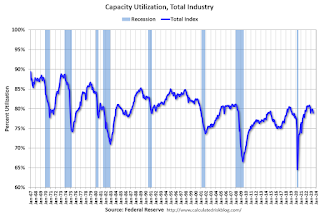
This graph shows Capacity Utilization. This series is up from the record low set in April 2020, and above the level in February 2020 (pre-pandemic).
Capacity utilization at 78.9% is 0.8 percentage points below the average from 1972 to 2022. This was below consensus expectations.
Note: y-axis doesn't start at zero to better show the change.
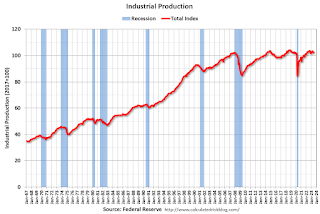 The second graph shows industrial production since 1967.
Industrial production decreased in June to 102.2. This is above the pre-pandemic level.
Industrial production was below consensus expectations, and the previous months were revised down, combined.
Retail Sales Increased 0.2% in June
by Calculated Risk on 7/18/2023 08:30:00 AM
On a monthly basis, retail sales were up 0.2% from May to June (seasonally adjusted), and sales were up 1.5 percent from June 2022.
From the Census Bureau report:
Advance estimates of U.S. retail and food services sales for June 2023, adjusted for seasonal variation and holiday and trading-day differences, but not for price changes, were $689.5 billion, up 0.2 percent from the previous month, and up 1.5 percent above June 2022. ... The April 2023 to May 2023 percent change was revised from up 0.3 percent to up 0.5 percent.
emphasis added
 Click on graph for larger image.
This graph shows retail sales since 1992. This is monthly retail sales and food service, seasonally adjusted (total and ex-gasoline).
Retail sales ex-gasoline were up 0.3% in June.
The second graph shows the year-over-year change in retail sales and food service (ex-gasoline) since 1993.
Retail and Food service sales, ex-gasoline, increased by 4.1% on a YoY basis.
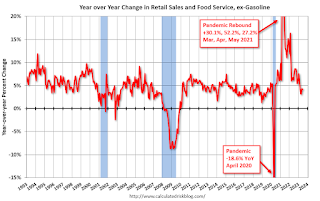 The increase in sales in June was below expectations, however sales in April and May were revised up.
Monday, July 17, 2023
Tuesday: Retail Sales, Industrial Production, Homebuilder Survey
by Calculated Risk on 7/17/2023 08:30:00 PM
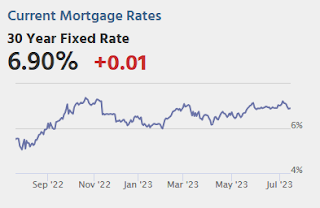
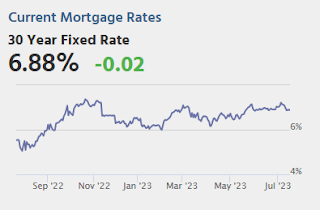
The average lender is right in line with the rates seen on Friday (which are still substantially lower than the rates seen on the previous Friday). In fact, the average lender is still roughly a quarter of percent lower versus July 6/7. [30 year fixed 6.90%]Tuesday:
emphasis added
• At 8:30 AM ET, Retail sales for June is scheduled to be released. The consensus is for 0.5% increase in retail sales.
• At 9:15 AM, The Fed will release Industrial Production and Capacity Utilization for June. The consensus is for a no change in Industrial Production, and for Capacity Utilization to decrease to 79.5%.
• At 10:00 AM, The July NAHB homebuilder survey. The consensus is for a reading of 55, unchanged from 55. Any number above 50 indicates that more builders view sales conditions as good than poor.
MBA Survey: "Share of Mortgage Loans in Forbearance Decreases to 0.44% in June"
by Calculated Risk on 7/17/2023 04:16:00 PM
Interesting - the states that have seen price decreases (in the West) have the most current loans (see bottom). There is no financial distress related to price decreases.
From the MBA: Share of Mortgage Loans in Forbearance Decreases to 0.44% in June
The Mortgage Bankers Association’s (MBA) monthly Loan Monitoring Survey revealed that the total number of loans now in forbearance decreased by 5 basis points from [0.49%] of servicers’ portfolio volume in the prior month to [0.44%] as of June 30, 2023. According to MBA’s estimate, 220,000 homeowners are in forbearance plans. Mortgage servicers have provided forbearance to approximately 7.9 million borrowers since March 2020.
In June 2023, the share of Fannie Mae and Freddie Mac loans in forbearance decreased 2 basis points to 0.21%. Ginnie Mae loans in forbearance decreased 13 basis points to 0.93%, and the forbearance share for portfolio loans and private-label securities (PLS) decreased 6 basis points to 0.52%.
“Mortgage forbearance has declined because most homeowners have maintained or improved their financial health,” said Marina Walsh, CMB, MBA’s Vice President of Industry Analysis. “Recent reporting by the U.S. Bureau of Labor Statistics shows continued job growth in June, and a 3.6 percent unemployment rate. The employment situation tracks with homeowners’ ability to make mortgage payments.”
emphasis added
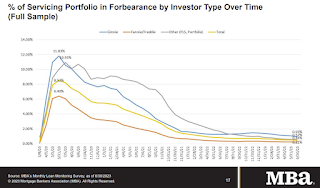 Click on graph for larger image.
This graph shows the percent of portfolio in forbearance by investor type over time.
The share of forbearance plans has been decreasing, declined to 0.44% in June from 0.49% in May.
At the end of June, there were about 220,000 homeowners in forbearance plans.
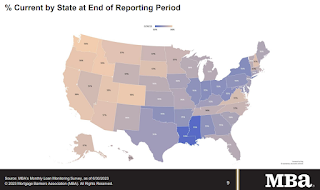 The second graph shows the percent of mortgages current by state.
From the MBA:
• Total loans serviced that were current (not delinquent or in foreclosure) as a percent of servicing portfolio volume (#) remained flat at 96.12% (on a non-seasonally adjusted basis) in June 2023 compared to May 2023.
• The five states with the highest share of loans that were current as a percent of servicing portfolio: Washington, Idaho, Colorado, Oregon, and California.
• The five states with the lowest share of loans that were current as a percent of servicing portfolio: Mississippi, Louisiana, New York, Indiana, and West Virginia.
Will house prices decline further later this year?
by Calculated Risk on 7/17/2023 12:57:00 PM
Today, in the Calculated Risk Real Estate Newsletter: Will house prices decline further later this year?
A brief excerpt:
In November 2021, I wrote Inventory will Tell the Tale and recounted how changes in housing inventory had helped me forecast the housing market at several key points.There is much more in the article. You can subscribe at https://calculatedrisk.substack.com/I believe inventory will tell the tale. That is why I watch inventory closely.So, based on the low level of inventory in March 2022, I wrote Housing: Don't Compare the Current Housing Boom to the Bubble and Bust, and I expected a decline in real house prices (inflation adjusted), and little decline in nominal prices.
I noted we could be fairly confident that we wouldn’t see cascading nominal price declines like during the housing bust since there would be few distressed sales.
Then, as inventory picked up sharply in 2022, I adjusted my outlook in October 2022 and wrote House Prices: 7 Years in Purgatory. I noted that a 10% decline in nominal prices “now seemed likely”.
Here is a graph of active listing from Realtor.com through June. Note the surge in inventory in mid-2022 as mortgage rates increased.
However, the inventory surge in 2022 was somewhat of a head fake! Some potential sellers quickly listed their homes, probably remembering what happened with house prices in the 2006 to 2011 period, but that surge ended pretty quickly.


