 RSS Feed
 by Calculated Risk on 7/20/2023 06:53:00 PM
Thursday, July 20, 2023
Realtor.com Reports Weekly Active Inventory Down 6% YoY; New Listings Down 19% YoY
Realtor.com has monthly and weekly data on the existing home market. Here is their weekly report from Sabrina Speianu and Danielle Hale: Weekly Housing Trends View — Data Week Ending July 15, 2023
• Active inventory declined, with for-sale homes lagging behind year ago levels by 6%. Following a year of declining newly listed homes, the stock of active inventory began to decline in June and this past week continued a four week trend with an annual decline of 6%. As interest rates remain elevated, hampering selling activity, we expect the stock of homes for sale to continue to remain low, declining by 5% overall for the year. .
• New listings–a measure of sellers putting homes up for sale–were down again this week, by 19% from one year ago. The number of newly listed homes has been lower than the same time the previous year for the past 54 weeks. This past week, newly listed homes were down 19% compared to the same time last year. However, this past week’s data showed a more narrow gap than the previous week, as 102,000 newly listed homes were added to the nation’s housing inventory, the highest level in five weeks. Seller sentiment, as measured by Fannie Mae’s Home Purchase Sentiment Index, was net positive in June, however higher interest rates continue to ‘lock-in’ otherwise would-be home sellers and in response selling sentiment declined from the month before.
 Here is a graph of the year-over-year change in inventory according to realtor.com.
 Inventory was down 5.0% year-over-year - this was the fourth consecutive YoY decrease following 58 consecutive weeks with a YoY increase in inventory.
Inventory is still up from the record lows in the 2nd half of 2021 and early 2022, and it is unlikely we will see new record lows by this measure this year.
Hotels: Occupancy Rate Up 0.1% Year-over-year
by Calculated Risk on 7/20/2023 02:44:00 PM
U.S. hotel performance increased from the previous week and showed improved comparisons year over year, according to CoStar’s latest data through 15 July. ...The following graph shows the seasonal pattern for the hotel occupancy rate using the four-week average.
9-15 July 2023 (percentage change from comparable week in 2022):
• Occupancy: 72.0% (+0.1%)
• Average daily rate (ADR): US$159.98 (+1.5%)
• Revenue per available room (RevPAR): US$115.18 (+1.6%)
emphasis added
 Click on graph for larger image.
The red line is for 2023, black is 2020, blue is the median, and dashed light blue is for 2022. Dashed purple is for 2018, the record year for hotel occupancy.
The 4-week average of the occupancy rate is at the median rate for the period 2000 through 2022 (Blue).
Note: Y-axis doesn't start at zero to better show the seasonal change.
The 4-week average of the occupancy rate will increase seasonally over the next several weeks.
NAR: Existing-Home Sales Decreased to 4.16 million SAAR in June; Median Prices Declined 0.9% YoY in June
by Calculated Risk on 7/20/2023 10:48:00 AM
Today, in the CalculatedRisk Real Estate Newsletter: NAR: Existing-Home Sales Decreased to 4.16 million SAAR in June; Median Prices Declined 0.9% YoY in June
Excerpt:
On prices, the NAR reported:There is much more in the article. You can subscribe at https://calculatedrisk.substack.com/ Please subscribe!The median existing-home price for all housing types in June was $410,200, the second-highest price of all time and down 0.9% from the record-high of $413,800 in June 2022. The monthly median price surpassed $400,000 for the third time, joining June 2022 and May 2022 ($408,600). Prices rose in the Northeast and Midwest but waned in the South and West.Median prices are distorted by the mix (repeat sales indexes like Case-Shiller and FHFA are probably better for measuring prices).
The YoY change in the median price peaked at 25.2% in May 2021 and prices are now down 0.9% YoY. Median house prices increased 3.5% from May to June and are down 0.9% from the peak in June 2022 (NSA). The median price tends to lead the Case-Shiller index, and this is further evidence that Case-Shiller will likely turn positive year-over-year.
Note that closed sales in June were mostly for contracts signed in April and May. Mortgage rates, according to the Freddie Mac PMMS, average around 6.4% in April and May. July sales will be for contracts signed in May and June, mortgage rates averaged 6.7% in June, so closed sales will likely be similar or less in July compared to June.

NAR: Existing-Home Sales Decreased to 4.16 million SAAR in June
by Calculated Risk on 7/20/2023 10:03:00 AM
From the NAR: Existing-Home Sales Retreated 3.3% in June; Monthly Median Sales Price Reached Second-Highest Amount Ever
Existing-home sales slipped in June, according to the National Association of REALTORS®. Sales varied among the four major U.S. regions, with the Northeast experiencing gains, the Midwest holding steady, and the South and West posting decreases. All four regions recorded year-over-year sales declines.
Total existing-home sales – completed transactions that include single-family homes, townhomes, condominiums and co-ops – receded 3.3% from May to a seasonally adjusted annual rate of 4.16 million in June. Year-over-year, sales fell 18.9% (down from 5.13 million in June 2022).
...
Total housing inventory registered at the end of June was 1.08 million units, identical to May but down 13.6% from one year ago (1.25 million). Unsold inventory sits at a 3.1-month supply at the current sales pace, up from 3.0 months in May and 2.9 months in June 2022.
emphasis added
 Click on graph for larger image.
This graph shows existing home sales, on a Seasonally Adjusted Annual Rate (SAAR) basis since 1994.
Sales in June (4.16 million SAAR) were down 3.3% from the previous month and were 18.9% below the June 2022 sales rate.
The second graph shows nationwide inventory for existing homes.
 According to the NAR, inventory was unchanged at 1.08 million in June from 1.08 million in May.
 According to the NAR, inventory was unchanged at 1.08 million in June from 1.08 million in May.
Headline inventory is not seasonally adjusted, and inventory usually decreases to the seasonal lows in December and January, and peaks in mid-to-late summer.
The last graph shows the year-over-year (YoY) change in reported existing home inventory and months-of-supply. Since inventory is not seasonally adjusted, it really helps to look at the YoY change. Note: Months-of-supply is based on the seasonally adjusted sales and not seasonally adjusted inventory.
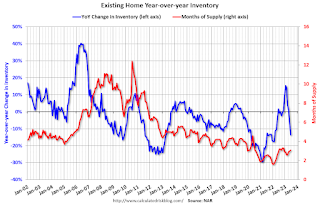 Inventory was down 13.6% year-over-year (blue) in June compared to June 2022.
Months of supply (red) increased to 3.1 months in June from 3.0 months in May.
This was below the consensus forecast. I'll have more later.
The last graph shows the year-over-year (YoY) change in reported existing home inventory and months-of-supply. Since inventory is not seasonally adjusted, it really helps to look at the YoY change. Note: Months-of-supply is based on the seasonally adjusted sales and not seasonally adjusted inventory.
 Inventory was down 13.6% year-over-year (blue) in June compared to June 2022.
 Months of supply (red) increased to 3.1 months in June from 3.0 months in May.
This was below the consensus forecast. I'll have more later.
Weekly Initial Unemployment Claims Decrease to 228,000
by Calculated Risk on 7/20/2023 08:33:00 AM
The DOL reported:
In the week ending July 15, the advance figure for seasonally adjusted initial claims was 228,000, a decrease of 9,000 from the previous week's unrevised level of 237,000. The 4-week moving average was 237,500, a decrease of 9,250 from the previous week's unrevised average of 246,750.The following graph shows the 4-week moving average of weekly claims since 1971.
emphasis added
 Click on graph for larger image.
The dashed line on the graph is the current 4-week average. The four-week average of weekly unemployment claims decreased to 237,500.
The previous week was unrevised.
Weekly claims were below the consensus forecast.
Wednesday, July 19, 2023
Thursday: Unemployment Claims, Philly Fed Mfg, Existing Home Sales
by Calculated Risk on 7/19/2023 08:47:00 PM
 Note: Mortgage rates are from MortgageNewsDaily.com and are for top tier scenarios.
Wednesday:
• At 8:30 AM ET, The initial weekly unemployment claims report will be released. The consensus is for 246 thousand initial claims, up from 237 thousand last week.
• Also at 8:30 AM, the Philly Fed manufacturing survey for July. The consensus is for a reading of -10.0, up from -13.7.
• At 10:00 AM, Existing Home Sales for June from the National Association of Realtors (NAR). The consensus is for 4.23million SAAR, down from 4.30 million last month.
Lawler: Early Read on Existing Home Sales in June & 4th Look at Local Markets
by Calculated Risk on 7/19/2023 02:39:00 PM
Today, in the Calculated Risk Real Estate Newsletter: Lawler: Early Read on Existing Home Sales in June & 4th Look at Local Markets
A brief excerpt:
An early read from housing economist Tom Lawler:There is much more in the article. You can subscribe at https://calculatedrisk.substack.com/Based on publicly-available local realtor/MLS reports released across the country through today, I project that existing home sales as estimated by the National Association of Realtors ran at a seasonally adjusted annual rate of 4.26 million in June, down 0.9% from May’s preliminary pace and down 17.0% from last June’s seasonally adjusted pace.Note: the NAR is scheduled to release June existing home sales tomorrow, Thursday, July 20th, and the consensus expectation is for the NAR to report sales of 4.23 million on a Seasonally Adjusted Annual Rate (SAAR) basis, down from 4.30 million in May.
Local realtor/MLS reports suggest that the median existing single-family home sales price last month was virtually unchanged from a year earlier.
...
In June, sales in these markets were down 14.9%. In June, these same markets were down 15.9% YoY Not Seasonally Adjusted (NSA).
This is a smaller YoY decline NSA than in May for these markets. Note that there were the same number of selling days each year in June 2022 and June 2023.
A key factor in the smaller YoY decline was that sales were steadily declining last year due to higher mortgage rates.
This sample data suggests that June existing home sales report will show another significant YoY decline - and will probably be below the May sales rate of 4.30 million (SAAR) - and the 22nd consecutive month with a YoY decline in sales.
I’ll have several more local markets after that will be released after the NAR report, including New York, Miami, and Illinois.

AIA: Architecture Billings "Stable" in June; Multi-family Billings Decline for 11th Consecutive Month
by Calculated Risk on 7/19/2023 12:21:00 PM
Note: This index is a leading indicator primarily for new Commercial Real Estate (CRE) investment.
From the AIA: AIA/Deltek Architecture Billings Index Stable in June
Architecture firms reported flat billings in June, according to the latest Architecture Billings Index (ABI) from the American Institute of Architects (AIA) and Deltek.
The ABI score of 50.1 for the month indicates that billings at architecture firms remained steady as design activity continues to slowly recover from roiled economic conditions. This also marks the first time since last fall that there have been two consecutive months of scores above 50, although growth in June was weaker than May (any score above 50 indicates an increase in firm billings).
“It is encouraging to see two consecutive months of stability in billings after a couple quarters of weakness due to high inflation, rising interest rates, and increased construction costs,” said AIA Chief Economist Kermit Baker, PhD, Hon. AIA. “We are still facing some headwinds in the broader economy, but this respite suggests that market conditions may be finding firmer ground.”
Firms located in the Midwest continue to report the strongest billings for the eighth consecutive month, while firms in nearly all regions of the country also reported improving business conditions in June. Firms also reported that inquiries into new projects fell slightly from 57.2 to 56.7 the previous month. Further, the value of new design contracts edged up to 52.7 in June from 52.3 in May.
Firm backlogs have decreased from their record-high levels in 2022 but remain robust at an average of 6.8 months.
...
• Regional averages: Midwest (52.4); Northeast (50.6); South (50.5); West (48.6)
• Sector index breakdown: institutional (55.4); mixed practice (firms that do not have at least half of their billings in any one other category) (48.8); commercial/industrial (47.8); multi-family residential (47.4)
emphasis added
 Click on graph for larger image.
This graph shows the Architecture Billings Index since 1996. The index was at 50.1 in June, down from 51.0 in May. Anything above 50 indicates an increase in demand for architects' services.
Note: This includes commercial and industrial facilities like hotels and office buildings, multi-family residential, as well as schools, hospitals and other institutions.
This index has declined in 6 of the last 9 months. This index usually leads CRE investment by 9 to 12 months, so this index suggests a slowdown in CRE investment later in 2023 and into 2024.
Note that multi-family billing turned down in August 2022 and has been negative for ELEVEN consecutive months (with revisions). This suggests we will see a further downturn in multi-family starts this year.
June Housing Starts: Record Number of Multi-Family Housing Units Under Construction
by Calculated Risk on 7/19/2023 09:27:00 AM
Today, in the CalculatedRisk Real Estate Newsletter: June Housing Starts: Record Number of Multi-Family Housing Units Under Construction
Excerpt:
The fourth graph shows housing starts under construction, Seasonally Adjusted (SA).There is much more in the post. You can subscribe at https://calculatedrisk.substack.com/
Red is single family units. Currently there are 688 thousand single family units (red) under construction (SA). This was down in June compared to May, and 143 thousand below the recent peak in May 2022. Single family units under construction peaked over a year ago since single family starts declined sharply.
Blue is for 2+ units. Currently there are 994 thousand multi-family units under construction. This ties the record set in July 1973 of multi-family units being built for the baby-boom generation. For multi-family, construction delays are a significant factor. The completion of these units should help with rent pressure.
Combined, there are 1.682 million units under construction, just 28 thousand below the all-time record of 1.710 million set in October 2022.

Housing Starts Decreased Sharply to 1.434 million Annual Rate in June
by Calculated Risk on 7/19/2023 08:37:00 AM
From the Census Bureau: Permits, Starts and Completions
Housing Starts:
Privately‐owned housing starts in June were at a seasonally adjusted annual rate of 1,434,000. This is 8.0 percent below the revised May estimate of 1,559,000 and is 8.1 percent below the June 2022 rate of 1,561,000. Single‐family housing starts in June were at a rate of 935,000; this is 7.0 percent below the revised May figure of 1,005,000. The June rate for units in buildings with five units or more was 482,000.
Building Permits:
Privately‐owned housing units authorized by building permits in June were at a seasonally adjusted annual rate of 1,440,000. This is 3.7 percent below the revised May rate of 1,496,000 and is 15.3 percent below the June 2022 rate of 1,701,000. Single‐family authorizations in June were at a rate of 922,000; this is 2.2 percent above the revised May figure of 902,000. Authorizations of units in buildings with five units or more were at a rate of 467,000 in June.
emphasis added
 Click on graph for larger image.
The first graph shows single and multi-family housing starts for the last several years.
Multi-family starts (blue, 2+ units) decreased in June compared to May. Multi-family starts were down 9.4% year-over-year in June.
Single-family starts (red) decreased in June and were down 7.4% year-over-year.
 The second graph shows single and multi-family housing starts since 1968.
 This shows the huge collapse following the housing bubble, and then the eventual recovery - and the recent collapse in single-family starts.
Total housing starts in June were below expectations, and starts in April and May were revised down, combined.
I'll have more later …


