by Calculated Risk on 7/22/2023 02:11:00 PM
Saturday, July 22, 2023
Real Estate Newsletter Articles this Week: Record Number of Multi-Family Housing Units Under Construction
At the Calculated Risk Real Estate Newsletter this week:
• June Housing Starts: Record Number of Multi-Family Housing Units Under Construction
• NMHC: "Apartment Market Continues to Loosen"
• Will house prices decline further later this year? (pay)
• NAR: Existing-Home Sales Decreased to 4.16 million SAAR in June
• Final Look at Local Housing Markets in June
• Lawler: Early Read on Existing Home Sales in June & 4th Look at Local Markets
This is usually published 4 to 6 times a week and provides more in-depth analysis of the housing market.
You can subscribe at https://calculatedrisk.substack.com/
Most content is available for free (and no Ads), but please subscribe!
Schedule for Week of July 23, 2023
by Calculated Risk on 7/22/2023 08:11:00 AM
The key report this week is the advance estimate of Q2 GDP.
Other key reports include June New Home Sales, Personal Income and Outlays for June, and Case-Shiller house prices for May.
For manufacturing, the July Richmond and Kansas City Fed manufacturing surveys will be released.
The FOMC meets this week and is expected to raise rates 25 bp.
8:30 AM ET: Chicago Fed National Activity Index for June. This is a composite index of other data.
 9:00 AM: S&P/Case-Shiller House Price Index for May.
This graph shows the year-over-year change in the seasonally adjusted National Index, Composite 10 and Composite 20 indexes through the most recent report (the Composite 20 was started in January 2000).
The consensus is for a 1.9% year-over-year decrease in the Comp 20 index for May.
9:00 AM: FHFA House Price Index for May. This was originally a GSE only repeat sales, however there is also an expanded index.
10:00 AM: Richmond Fed Survey of Manufacturing Activity for July.
7:00 AM ET: The Mortgage Bankers Association (MBA) will release the results for the mortgage purchase applications index.
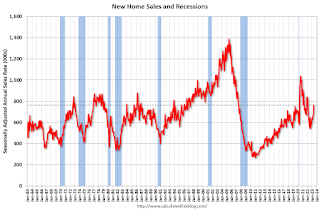 10:00 AM: New Home Sales for June from the Census Bureau.
 This graph shows New Home Sales since 1963. The dashed line is the sales rate for last month.
The consensus is for 722 thousand SAAR, down from 763 thousand in May.
2:00 PM: FOMC Meeting Announcement. The FOMC is expected to raise rates 25 bps, increasing the target range for the federal funds rate to 5‑1/4 to 5-1/2 percent.
2:30 PM: Fed Chair Jerome Powell holds a press briefing following the FOMC announcement.
8:30 AM: The initial weekly unemployment claims report will be released. The consensus is for 240 thousand initial claims, up from 228 thousand last week.
8:30 AM: Gross Domestic Product, 2nd quarter (advance estimate), and annual update. The consensus is that real GDP increased 1.8% annualized in Q2, down from 2.0% in Q1.
8:30 AM: Durable Goods Orders for June from the Census Bureau. The consensus is for a 1.0% increase in durable goods orders.
10:00 AM: Pending Home Sales Index for June. The consensus is for a 0.1% increase in the index.
11:00 AM: Kansas City Fed Survey of Manufacturing Activity for July.
8:30 AM ET: Personal Income and Outlays, June 2022. The consensus is for a 0.4% increase in personal income, and for a 0.4% increase in personal spending. And for the Core PCE price index to increase 0.2%. PCE prices are expected to be up 3.1% YoY, and core PCE prices up 4.2% YoY.
10:00 AM: University of Michigan's Consumer sentiment index (Final for July). The consensus is for a reading of 72.6.
Friday, July 21, 2023
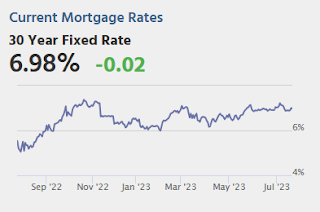
July 21st COVID Update: New Pandemic Lows for Deaths and Hospitalizations
by Calculated Risk on 7/21/2023 08:09:00 PM
| COVID Metrics | ||||
|---|---|---|---|---|
| Now | Week Ago | Goal | ||
| Hospitalized2 | 5,210 | 5,217 | ≤3,0001 | |
| Deaths per Week2 | 447 | 531 | ≤3501 | |
| 1my goals to stop weekly posts, 2Weekly for Currently Hospitalized, and Deaths 🚩 Increasing number weekly for Hospitalized and Deaths ✅ Goal met. | ||||
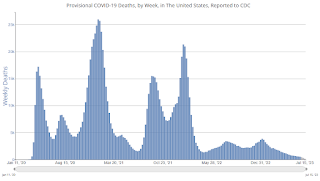 Click on graph for larger image.
This graph shows the weekly (columns) number of deaths reported.
Final Look at Local Housing Markets in June
by Calculated Risk on 7/21/2023 02:00:00 PM
Today, in the Calculated Risk Real Estate Newsletter: Final Look at Local Housing Markets in June
A brief excerpt:
Each month I track closed sales, new listings and active inventory in a sample of local markets around the country (over 40 local housing markets) in the US to get an early sense of changes in the housing market. In addition, we can look for regional differences. For example, listings in Texas and Florida are up more than in most other areas, and sales are down less year-over-year.There is much more in the article. You can subscribe at https://calculatedrisk.substack.com/
After the National Association of Realtors® (NAR) releases the monthly existing home sales report, I pick up additional local market data that is reported after the NAR (and I’m frequently adding more markets). This is the final look at local markets in June.
The big story for June existing home sales was the large year-over-year (YoY) decline in sales. Also new listings were down sharply YoY and active listings are now down YoY.
...
In June, sales in these markets were down 16.7%. In May, these same markets were down 17.4% YoY Not Seasonally Adjusted (NSA).
...
My early expectation is we will see a somewhat lower level of sales in July on a seasonally adjusted annual rate basis (SAAR) than in June. 30-year mortgage rates averaged about 6.4% in April and May (for closed sales in June), and 30-year rates increased to 6.7% in June (closed sales in July will be mostly for contracts signed in May and June).
More local data coming in August for activity in July!
Q2 GDP Tracking: Around 2%
by Calculated Risk on 7/21/2023 10:09:00 AM
The preliminary estimate for Q2 GDP is scheduled to be released this coming Thursday, July 27th. The consensus estimate is for real GDP to increase 1.8% SAAR from Q1.
From BofA:
Data since our last weekly publication moved up our 2Q GDP tracking estimate from 1.5% q/q saar to 1.6%. [July 21st estimate]From Goldman:
emphasis added
We left our Q2 GDP tracking estimate unchanged at +2.5% (qoq ar). Our Q2 domestic final sales growth forecast stands at +2.5%. [July 20th estimate]And from the Altanta Fed: GDPNow
The GDPNow model estimate for real GDP growth (seasonally adjusted annual rate) in the second quarter of 2023 is 2.4 percent on July 19, unchanged from July 18 after rounding. [July 19th estimate]
Black Knight: "Seriously Delinquent Mortgages Hit Lowest Level Since 2006" in June
by Calculated Risk on 7/21/2023 08:11:00 AM
From Black Knight: Black Knight’s First Look: Seriously Delinquent Mortgages Hit Lowest Level Since 2006; Prepayments Trended Seasonally Higher in June Despite Elevated Interest Rates
• Inching up 2 basis points from May, the national delinquency rate continues to hover near recent record lows, with June’s marking the third lowest level on recordAccording to Black Knight's First Look report, the percent of loans delinquent increased 0.55% in June compared to May and decreased 2.8% year-over-year.
• The number of serious delinquencies (loans 90+ days past due) dropped to 471K – the lowest since August 2006 – and a 177K (-27%) improvement from June 2022
• Early-stage delinquencies (30-days late) increased by 19K (+2.2%), while borrowers who’ve missed two payments (60-days past due) ticked up by 5K (+1.7%)
• Foreclosure starts also increased slightly to 28K for the month – just 1% above the preceding 12-month average and still 38% below the June 2019’s pre-pandemic level
• Foreclosure was started on 5.8% of serious delinquencies in June, up from 5.1% in May but still three percentage points below the start rate in May 2019 before the onset of the pandemic
• The number of loans in active foreclosure shrunk another 5K in June and is still down 47K (-17%) from March 2020; meanwhile, June’s 6.9K foreclosure sales (completions) marked a 1.5% increase from May
emphasis added
Black Knight reported the U.S. mortgage delinquency rate (loans 30 or more days past due, but not in foreclosure) was 3.12% in June, down from 3.10% the previous month.
The percent of loans in the foreclosure process decreased in June to 0.42%, from 0.43% the previous month.
| Black Knight: Percent Loans Delinquent and in Foreclosure Process | ||||
|---|---|---|---|---|
| June 2023 | May 2023 | |||
| Delinquent | 3.12% | 3.10% | ||
| In Foreclosure | 0.42% | 0.43% | ||
| Number of properties: | ||||
| Number of properties that are delinquent, but not in foreclosure: | 1,650,000 | 1,639,000 | ||
| Number of properties in foreclosure pre-sale inventory: | 224,000 | 229,000 | ||
| Total Properties | 1,874,000 | 1,868,000 | ||
Thursday, July 20, 2023
Realtor.com Reports Weekly Active Inventory Down 6% YoY; New Listings Down 19% YoY
by Calculated Risk on 7/20/2023 06:53:00 PM
Realtor.com has monthly and weekly data on the existing home market. Here is their weekly report from Sabrina Speianu and Danielle Hale: Weekly Housing Trends View — Data Week Ending July 15, 2023
• Active inventory declined, with for-sale homes lagging behind year ago levels by 6%. Following a year of declining newly listed homes, the stock of active inventory began to decline in June and this past week continued a four week trend with an annual decline of 6%. As interest rates remain elevated, hampering selling activity, we expect the stock of homes for sale to continue to remain low, declining by 5% overall for the year. .
• New listings–a measure of sellers putting homes up for sale–were down again this week, by 19% from one year ago. The number of newly listed homes has been lower than the same time the previous year for the past 54 weeks. This past week, newly listed homes were down 19% compared to the same time last year. However, this past week’s data showed a more narrow gap than the previous week, as 102,000 newly listed homes were added to the nation’s housing inventory, the highest level in five weeks. Seller sentiment, as measured by Fannie Mae’s Home Purchase Sentiment Index, was net positive in June, however higher interest rates continue to ‘lock-in’ otherwise would-be home sellers and in response selling sentiment declined from the month before.
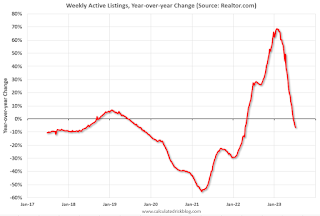 Here is a graph of the year-over-year change in inventory according to realtor.com.
 Inventory was down 5.0% year-over-year - this was the fourth consecutive YoY decrease following 58 consecutive weeks with a YoY increase in inventory.
Hotels: Occupancy Rate Up 0.1% Year-over-year
by Calculated Risk on 7/20/2023 02:44:00 PM
U.S. hotel performance increased from the previous week and showed improved comparisons year over year, according to CoStar’s latest data through 15 July. ...The following graph shows the seasonal pattern for the hotel occupancy rate using the four-week average.
9-15 July 2023 (percentage change from comparable week in 2022):
• Occupancy: 72.0% (+0.1%)
• Average daily rate (ADR): US$159.98 (+1.5%)
• Revenue per available room (RevPAR): US$115.18 (+1.6%)
emphasis added
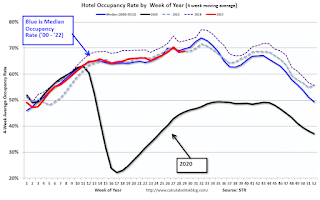 Click on graph for larger image.
The red line is for 2023, black is 2020, blue is the median, and dashed light blue is for 2022. Dashed purple is for 2018, the record year for hotel occupancy.
NAR: Existing-Home Sales Decreased to 4.16 million SAAR in June; Median Prices Declined 0.9% YoY in June
by Calculated Risk on 7/20/2023 10:48:00 AM
Today, in the CalculatedRisk Real Estate Newsletter: NAR: Existing-Home Sales Decreased to 4.16 million SAAR in June; Median Prices Declined 0.9% YoY in June
Excerpt:
On prices, the NAR reported:There is much more in the article. You can subscribe at https://calculatedrisk.substack.com/ Please subscribe!The median existing-home price for all housing types in June was $410,200, the second-highest price of all time and down 0.9% from the record-high of $413,800 in June 2022. The monthly median price surpassed $400,000 for the third time, joining June 2022 and May 2022 ($408,600). Prices rose in the Northeast and Midwest but waned in the South and West.Median prices are distorted by the mix (repeat sales indexes like Case-Shiller and FHFA are probably better for measuring prices).
The YoY change in the median price peaked at 25.2% in May 2021 and prices are now down 0.9% YoY. Median house prices increased 3.5% from May to June and are down 0.9% from the peak in June 2022 (NSA). The median price tends to lead the Case-Shiller index, and this is further evidence that Case-Shiller will likely turn positive year-over-year.
Note that closed sales in June were mostly for contracts signed in April and May. Mortgage rates, according to the Freddie Mac PMMS, average around 6.4% in April and May. July sales will be for contracts signed in May and June, mortgage rates averaged 6.7% in June, so closed sales will likely be similar or less in July compared to June.
NAR: Existing-Home Sales Decreased to 4.16 million SAAR in June
by Calculated Risk on 7/20/2023 10:03:00 AM
From the NAR: Existing-Home Sales Retreated 3.3% in June; Monthly Median Sales Price Reached Second-Highest Amount Ever
Existing-home sales slipped in June, according to the National Association of REALTORS®. Sales varied among the four major U.S. regions, with the Northeast experiencing gains, the Midwest holding steady, and the South and West posting decreases. All four regions recorded year-over-year sales declines.
Total existing-home sales – completed transactions that include single-family homes, townhomes, condominiums and co-ops – receded 3.3% from May to a seasonally adjusted annual rate of 4.16 million in June. Year-over-year, sales fell 18.9% (down from 5.13 million in June 2022).
...
Total housing inventory registered at the end of June was 1.08 million units, identical to May but down 13.6% from one year ago (1.25 million). Unsold inventory sits at a 3.1-month supply at the current sales pace, up from 3.0 months in May and 2.9 months in June 2022.
emphasis added
 Click on graph for larger image.
This graph shows existing home sales, on a Seasonally Adjusted Annual Rate (SAAR) basis since 1994.
Sales in June (4.16 million SAAR) were down 3.3% from the previous month and were 18.9% below the June 2022 sales rate.
 According to the NAR, inventory was unchanged at 1.08 million in June from 1.08 million in May.
The last graph shows the year-over-year (YoY) change in reported existing home inventory and months-of-supply. Since inventory is not seasonally adjusted, it really helps to look at the YoY change. Note: Months-of-supply is based on the seasonally adjusted sales and not seasonally adjusted inventory.
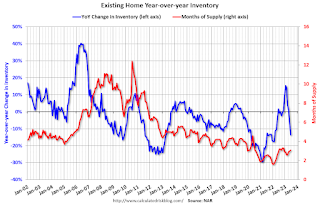 Inventory was down 13.6% year-over-year (blue) in June compared to June 2022.
 Months of supply (red) increased to 3.1 months in June from 3.0 months in May.
This was below the consensus forecast. I'll have more later.


