 RSS Feed
 by Calculated Risk on 7/24/2023 10:23:00 AM
Monday, July 24, 2023
Update on Four High Frequency Indicators
I stopped the weekly updates of high frequency indicators at the end of 2022.
Here is a late July look at four indicators:
The TSA is providing daily travel numbers.
This data is as of July 23rd.
 Click on graph for larger image.
This data shows the 7-day average of daily total traveler throughput from the TSA for 2019 (Light Blue), 2020 (Black), 2021 (Blue), 2022 (Orange) and 2023 (Red).
The dashed line is the percent of 2019 for the seven-day average.
The 7-day average is above the level for the same week in 2019 (101.4% of 2019). (Dashed line)
Air travel - as a percent of 2019 - is tracking pre-pandemic levels.
----- Movie Tickets: Box Office Mojo -----
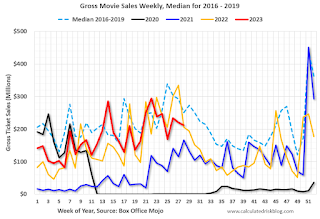 This data shows domestic box office for each week and the median for the years 2016 through 2019 (dashed light blue).
 This data shows domestic box office for each week and the median for the years 2016 through 2019 (dashed light blue).
 Black is 2020, Blue is 2021 and Red is 2022.
The data is from BoxOfficeMojo through July 20th.
Note that the data is usually noisy week-to-week and depends on when blockbusters are released. This is prior to Barbie and Oppenheimer.
Movie ticket sales (dollars) have been running below the pre-pandemic levels.
Note that the data is usually noisy week-to-week and depends on when blockbusters are released. This is prior to Barbie and Oppenheimer.
Movie ticket sales (dollars) have been running below the pre-pandemic levels.
 This graph shows the seasonal pattern for the hotel occupancy rate using the four-week average.
 The red line is for 2023, black is 2020, blue is the median, and dashed light blue is for 2022. Dashed purple is for 2018, the record year for hotel occupancy.
This data is through July 15th. The occupancy rate was up 0.1% compared to the same week in 2022.
The 4-week average of the occupancy rate is at the median rate for the period 2000 through 2022 (Blue).
Notes: Y-axis doesn't start at zero to better show the seasonal change.
Notes: Y-axis doesn't start at zero to better show the seasonal change.

This graph, based on weekly data from the U.S. Energy Information Administration (EIA) shows gasoline supplied compared to the same week of 2019.
Blue is for 2020. Purple is for 2021, and Orange is for 2022, and Red is for 2023.
Gasoline supplied in 2023 is running about 4% below 2019 levels.
Housing July 24th Weekly Update: Inventory increased 1.9% Week-over-week; Down 8.8% Year-over-year
by Calculated Risk on 7/24/2023 08:15:00 AM
Altos reports that active single-family inventory was up 1.9% week-over-week.
 Click on graph for larger image.
This inventory graph is courtesy of Altos Research.
As of July 21st, inventory was at 479 thousand (7-day average), compared to 470 thousand the prior week.
Year-to-date, inventory is down 2.4%. And inventory is up 18.2% from the seasonal bottom 14 weeks ago.

The red line is for 2023. The black line is for 2019. Note that inventory is up from the record low for the same week in 2021, but below last year and still well below normal levels.
Inventory was down 8.8% compared to the same week in 2022 (last week it was down 7.5%), and down 50.1% compared to the same week in 2019 (last week down 50.5%).
It appears same week inventory will be below 2022 levels for the remainder of the year. It is possible that inventory will fall below the record lows in 2021 and early 2022 later this year or in early 2024, but currently that seems unlikely.
Mike Simonsen discusses this data regularly on Youtube.
Sunday, July 23, 2023
Sunday Night Futures
by Calculated Risk on 7/23/2023 06:25:00 PM
Weekend:
• Schedule for Week of July 23, 2023
• FOMC Preview: Likely 25bp Rate Hike
Monday:
• 8:30 AM ET, Chicago Fed National Activity Index for June. This is a composite index of other data.
From CNBC: Pre-Market Data and Bloomberg futures S&P 500 and DOW futures are down slightly (fair value).
Oil prices were up over the last week with WTI futures at $77.07 per barrel and Brent at $81.07 per barrel. A year ago, WTI was at $98, and Brent was at $107 - so WTI oil prices are down about 20% year-over-year.
Here is a graph from Gasbuddy.com for nationwide gasoline prices. Nationally prices are at $3.56 per gallon. A year ago, prices were at $4.35 per gallon, so gasoline prices are down $0.78 per gallon year-over-year.
FOMC Preview: Likely 25bp Rate Hike
by Calculated Risk on 7/23/2023 08:14:00 AM
Most analysts expect the FOMC to raise rates 25 bps at this meeting, increasing the target range for the federal funds rate to 5‑1/4 to 5-1/2 percent.
On the meeting this week from BofA:
"After remaining on hold in June, we look for the Fed to raise the target range for the Federal funds rate by 25bp in July to 5.25-5.50%. ... The more important question is what the Fed says about the path of policy into September and beyond. ... We think some of the June CPI weakness was statistical and not real, and look for strong activity and labor market data to mean the Fed hikes again – and for the last time – at its September meeting."And from Goldman Sachs economists:
emphasis added
"A 25bp rate hike is fully priced for the July FOMC meeting next week. The key question is how strongly Chair Powell will nod toward the “careful pace” of tightening he advocated in June, which we and others have taken to imply an every-other-meeting approach. We expect Powell to cautiously avoid implying that the FOMC has already reached an agreement but are confident that he does want to slow the pace and that the FOMC will end up skipping in September."
Projections will not be released at this meeting. For review, here are the June projections. Since the last projections were released, the economy has performed better than the FOMC expected, and inflation was slightly below expectations.
The BEA reported real GDP increased at a 2.0% annual rate in Q1, and the consensus is that real GDP increased 1.8% annualized in Q2. The FOMC projection for year-over-year growth in Q4 2023 appears low.
| GDP projections of Federal Reserve Governors and Reserve Bank presidents, Change in Real GDP1 | ||||
|---|---|---|---|---|
| Projection Date | 2023 | 2024 | 2025 | |
| June 2023 | 0.7 to 1.2 | 0.9 to 1.5 | 1.6 to 2.0 | |
| March 2023 | 0.0 to 0.8 | 1.0 to 1.5 | 1.7 to 2.1 | |
The unemployment rate was at 3.6% in June. To reach the mid-point of the FOMC projections for Q4 2023, the economy would likely have to lose a significant number of jobs in Q3 and Q4. The FOMC's unemployment rate projection for Q4 appears high.
| Unemployment projections of Federal Reserve Governors and Reserve Bank presidents, Unemployment Rate2 | ||||
|---|---|---|---|---|
| Projection Date | 2023 | 2024 | 2025 | |
| June 2023 | 4.0 to 4.3 | 4.3 to 4.6 | 4.3 to 4.6 | |
| March 2023 | 4.0 to 4.7 | 4.3 to 4.9 | 4.3 to 4.8 | |
As of May 2023, PCE inflation increased 3.8 percent year-over-year (YoY), down from 4.4 percent YoY in April, and down from the recent peak of 7.0 percent in June 2022. A year ago, June 2022 PCE inflation was very high, and YoY PCE inflation will likely decrease further in June.
| Inflation projections of Federal Reserve Governors and Reserve Bank presidents, PCE Inflation1 | ||||
|---|---|---|---|---|
| Projection Date | 2023 | 2024 | 2025 | |
| June 2023 | 3.0 to 3.5 | 2.3 to 2.8 | 2.0 to 2.4 | |
| March 2023 | 3.0 to 3.8 | 2.2 to 2.8 | 2.0 to 2.2 | |
PCE core inflation increased 4.6 percent YoY, down from 4.7 percent in April, and down from the recent peak of 5.4 percent in February 2022.; This remains a concern for the FOMC, however this includes shelter that was up 8.3% YoY in May (even though asking rents are mostly unchanged YoY).
| Core Inflation projections of Federal Reserve Governors and Reserve Bank presidents, Core Inflation1 | ||||
|---|---|---|---|---|
| Projection Date | 2023 | 2024 | 2025 | |
| June 2023 | 3.7 to 4.2 | 2.5 to 3.1 | 2.0 to 2.4 | |
| March 2023 | 3.5 to 3.9 | 2.3 to 2.8 | 2.0 to 2.2 | |
Saturday, July 22, 2023
Real Estate Newsletter Articles this Week: Record Number of Multi-Family Housing Units Under Construction
by Calculated Risk on 7/22/2023 02:11:00 PM
At the Calculated Risk Real Estate Newsletter this week:
• June Housing Starts: Record Number of Multi-Family Housing Units Under Construction
• NMHC: "Apartment Market Continues to Loosen"
• Will house prices decline further later this year? (pay)
• NAR: Existing-Home Sales Decreased to 4.16 million SAAR in June
• Final Look at Local Housing Markets in June
• Lawler: Early Read on Existing Home Sales in June & 4th Look at Local Markets
This is usually published 4 to 6 times a week and provides more in-depth analysis of the housing market.
You can subscribe at https://calculatedrisk.substack.com/
Most content is available for free (and no Ads), but please subscribe!
Schedule for Week of July 23, 2023
by Calculated Risk on 7/22/2023 08:11:00 AM
The key report this week is the advance estimate of Q2 GDP.
Other key reports include June New Home Sales, Personal Income and Outlays for June, and Case-Shiller house prices for May.
For manufacturing, the July Richmond and Kansas City Fed manufacturing surveys will be released.
The FOMC meets this week and is expected to raise rates 25 bp.
8:30 AM ET: Chicago Fed National Activity Index for June. This is a composite index of other data.
 9:00 AM: S&P/Case-Shiller House Price Index for May.
This graph shows the year-over-year change in the seasonally adjusted National Index, Composite 10 and Composite 20 indexes through the most recent report (the Composite 20 was started in January 2000).
The consensus is for a 1.9% year-over-year decrease in the Comp 20 index for May.
9:00 AM: FHFA House Price Index for May. This was originally a GSE only repeat sales, however there is also an expanded index.
10:00 AM: Richmond Fed Survey of Manufacturing Activity for July.
7:00 AM ET: The Mortgage Bankers Association (MBA) will release the results for the mortgage purchase applications index.
 10:00 AM: New Home Sales for June from the Census Bureau.
 This graph shows New Home Sales since 1963. The dashed line is the sales rate for last month.
The consensus is for 722 thousand SAAR, down from 763 thousand in May.
2:00 PM: FOMC Meeting Announcement. The FOMC is expected to raise rates 25 bps, increasing the target range for the federal funds rate to 5‑1/4 to 5-1/2 percent.
2:30 PM: Fed Chair Jerome Powell holds a press briefing following the FOMC announcement.
8:30 AM: The initial weekly unemployment claims report will be released. The consensus is for 240 thousand initial claims, up from 228 thousand last week.
8:30 AM: Gross Domestic Product, 2nd quarter (advance estimate), and annual update. The consensus is that real GDP increased 1.8% annualized in Q2, down from 2.0% in Q1.
8:30 AM: Durable Goods Orders for June from the Census Bureau. The consensus is for a 1.0% increase in durable goods orders.
10:00 AM: Pending Home Sales Index for June. The consensus is for a 0.1% increase in the index.
11:00 AM: Kansas City Fed Survey of Manufacturing Activity for July.
8:30 AM ET: Personal Income and Outlays, June 2022. The consensus is for a 0.4% increase in personal income, and for a 0.4% increase in personal spending. And for the Core PCE price index to increase 0.2%. PCE prices are expected to be up 3.1% YoY, and core PCE prices up 4.2% YoY.
10:00 AM: University of Michigan's Consumer sentiment index (Final for July). The consensus is for a reading of 72.6.
Friday, July 21, 2023
July 21st COVID Update: New Pandemic Lows for Deaths and Hospitalizations
by Calculated Risk on 7/21/2023 08:09:00 PM
 Note: Mortgage rates are from MortgageNewsDaily.com and are for top tier scenarios.
Due to changes at the CDC, weekly cases are no longer updated.
After the first few weeks, the pandemic low for weekly deaths had been the week of July 7, 2021, at 1,690 deaths (until recently).
For COVID hospitalizations, the previous low was 9,821 (until recently).
The last few months have seen a positive trend.
| COVID Metrics | ||||
|---|---|---|---|---|
| Now | Week Ago | Goal | ||
| Hospitalized2 | 5,210 | 5,217 | ≤3,0001 | |
| Deaths per Week2 | 447 | 531 | ≤3501 | |
| 1my goals to stop weekly posts, 2Weekly for Currently Hospitalized, and Deaths 🚩 Increasing number weekly for Hospitalized and Deaths ✅ Goal met. | ||||
 Click on graph for larger image.
This graph shows the weekly (columns) number of deaths reported.
For deaths, I'm currently using 3 weeks ago for "now", since the most recent two weeks will be revised significantly.
Final Look at Local Housing Markets in June
by Calculated Risk on 7/21/2023 02:00:00 PM
Today, in the Calculated Risk Real Estate Newsletter: Final Look at Local Housing Markets in June
A brief excerpt:
Each month I track closed sales, new listings and active inventory in a sample of local markets around the country (over 40 local housing markets) in the US to get an early sense of changes in the housing market. In addition, we can look for regional differences. For example, listings in Texas and Florida are up more than in most other areas, and sales are down less year-over-year.There is much more in the article. You can subscribe at https://calculatedrisk.substack.com/
After the National Association of Realtors® (NAR) releases the monthly existing home sales report, I pick up additional local market data that is reported after the NAR (and I’m frequently adding more markets). This is the final look at local markets in June.
The big story for June existing home sales was the large year-over-year (YoY) decline in sales. Also new listings were down sharply YoY and active listings are now down YoY.
...
In June, sales in these markets were down 16.7%. In May, these same markets were down 17.4% YoY Not Seasonally Adjusted (NSA).
...
My early expectation is we will see a somewhat lower level of sales in July on a seasonally adjusted annual rate basis (SAAR) than in June. 30-year mortgage rates averaged about 6.4% in April and May (for closed sales in June), and 30-year rates increased to 6.7% in June (closed sales in July will be mostly for contracts signed in May and June).
More local data coming in August for activity in July!

Q2 GDP Tracking: Around 2%
by Calculated Risk on 7/21/2023 10:09:00 AM
The preliminary estimate for Q2 GDP is scheduled to be released this coming Thursday, July 27th. The consensus estimate is for real GDP to increase 1.8% SAAR from Q1.
From BofA:
Data since our last weekly publication moved up our 2Q GDP tracking estimate from 1.5% q/q saar to 1.6%. [July 21st estimate]From Goldman:
emphasis added
We left our Q2 GDP tracking estimate unchanged at +2.5% (qoq ar). Our Q2 domestic final sales growth forecast stands at +2.5%. [July 20th estimate]And from the Altanta Fed: GDPNow
The GDPNow model estimate for real GDP growth (seasonally adjusted annual rate) in the second quarter of 2023 is 2.4 percent on July 19, unchanged from July 18 after rounding. [July 19th estimate]
Black Knight: "Seriously Delinquent Mortgages Hit Lowest Level Since 2006" in June
by Calculated Risk on 7/21/2023 08:11:00 AM
From Black Knight: Black Knight’s First Look: Seriously Delinquent Mortgages Hit Lowest Level Since 2006; Prepayments Trended Seasonally Higher in June Despite Elevated Interest Rates
• Inching up 2 basis points from May, the national delinquency rate continues to hover near recent record lows, with June’s marking the third lowest level on recordAccording to Black Knight's First Look report, the percent of loans delinquent increased 0.55% in June compared to May and decreased 2.8% year-over-year.
• The number of serious delinquencies (loans 90+ days past due) dropped to 471K – the lowest since August 2006 – and a 177K (-27%) improvement from June 2022
• Early-stage delinquencies (30-days late) increased by 19K (+2.2%), while borrowers who’ve missed two payments (60-days past due) ticked up by 5K (+1.7%)
• Foreclosure starts also increased slightly to 28K for the month – just 1% above the preceding 12-month average and still 38% below the June 2019’s pre-pandemic level
• Foreclosure was started on 5.8% of serious delinquencies in June, up from 5.1% in May but still three percentage points below the start rate in May 2019 before the onset of the pandemic
• The number of loans in active foreclosure shrunk another 5K in June and is still down 47K (-17%) from March 2020; meanwhile, June’s 6.9K foreclosure sales (completions) marked a 1.5% increase from May
emphasis added
Black Knight reported the U.S. mortgage delinquency rate (loans 30 or more days past due, but not in foreclosure) was 3.12% in June, down from 3.10% the previous month.
The percent of loans in the foreclosure process decreased in June to 0.42%, from 0.43% the previous month.
The number of delinquent properties, but not in foreclosure, is down 24,000 properties year-over-year, and the number of properties in the foreclosure process is down 5,000 properties year-over-year.
| Black Knight: Percent Loans Delinquent and in Foreclosure Process | ||||
|---|---|---|---|---|
| June 2023 | May 2023 | |||
| Delinquent | 3.12% | 3.10% | ||
| In Foreclosure | 0.42% | 0.43% | ||
| Number of properties: | ||||
| Number of properties that are delinquent, but not in foreclosure: | 1,650,000 | 1,639,000 | ||
| Number of properties in foreclosure pre-sale inventory: | 224,000 | 229,000 | ||
| Total Properties | 1,874,000 | 1,868,000 | ||


