by Calculated Risk on 7/26/2023 08:44:00 PM
Wednesday, July 26, 2023
Thursday: GDP, Unemployment Claims, Durable Goods, Pending Home Sales
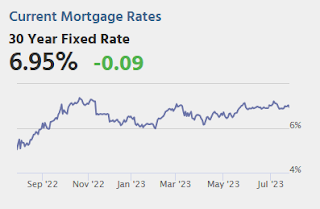
Thursday:
• At 8:30 AM ET, The initial weekly unemployment claims report will be released. The consensus is for 240 thousand initial claims, up from 228 thousand last week.
• Also at 8:30 AM, Gross Domestic Product, 2nd quarter (advance estimate), and annual update. The consensus is that real GDP increased 1.8% annualized in Q2, down from 2.0% in Q1.
• Also at 8:30 AM, Durable Goods Orders for June from the Census Bureau. The consensus is for a 1.0% increase in durable goods orders.
• At 10:00 AM, Pending Home Sales Index for June. The consensus is for a 0.1% increase in the index.
• At 11:00 AM, Kansas City Fed Survey of Manufacturing Activity for July.
FOMC Statement: Raise Rates 25 bp
by Calculated Risk on 7/26/2023 02:00:00 PM
Fed Chair Powell press conference video here or on YouTube here, starting at 2:30 PM ET.
FOMC Statement:
Recent indicators suggest that economic activity has been expanding at a moderate pace. Job gains have been robust in recent months, and the unemployment rate has remained low. Inflation remains elevated.
The U.S. banking system is sound and resilient. Tighter credit conditions for households and businesses are likely to weigh on economic activity, hiring, and inflation. The extent of these effects remains uncertain. The Committee remains highly attentive to inflation risks.
The Committee seeks to achieve maximum employment and inflation at the rate of 2 percent over the longer run. In support of these goals, the Committee decided to raise the target range for the federal funds rate to 5-1/4 to 5-1/2 percent. The Committee will continue to assess additional information and its implications for monetary policy. In determining the extent of additional policy firming that may be appropriate to return inflation to 2 percent over time, the Committee will take into account the cumulative tightening of monetary policy, the lags with which monetary policy affects economic activity and inflation, and economic and financial developments. In addition, the Committee will continue reducing its holdings of Treasury securities and agency debt and agency mortgage-backed securities, as described in its previously announced plans. The Committee is strongly committed to returning inflation to its 2 percent objective.
In assessing the appropriate stance of monetary policy, the Committee will continue to monitor the implications of incoming information for the economic outlook. The Committee would be prepared to adjust the stance of monetary policy as appropriate if risks emerge that could impede the attainment of the Committee's goals. The Committee's assessments will take into account a wide range of information, including readings on labor market conditions, inflation pressures and inflation expectations, and financial and international developments.
Voting for the monetary policy action were Jerome H. Powell, Chair; John C. Williams, Vice Chair; Michael S. Barr; Michelle W. Bowman; Lisa D. Cook; Austan D. Goolsbee; Patrick Harker; Philip N. Jefferson; Neel Kashkari; Lorie K. Logan; and Christopher J. Waller.
emphasis added
New Home Sales decrease to 697,000 Annual Rate in June; Median New Home Price is Down 16.4% from the Peak
by Calculated Risk on 7/26/2023 11:00:00 AM
Today, in the Calculated Risk Real Estate Newsletter: New Home Sales decrease to 697,000 Annual Rate in June
Brief excerpt:
And on prices, from the Census Bureau:You can subscribe at https://calculatedrisk.substack.com/.The median sales price of new houses sold in June 2023 was $415,400. The average sales price was $494,700.The following graph shows the median and average new home prices. The average price in June 2023 was $494,700 up 5% year-over-year. The median price was $415,400 down 4% year-over-year. Both the median and the average are impacted by the mix of homes sold.
The median price is down 16.4% from the peak in 2022, and the average prices is down 13.0% from the peak.
New Home Sales decrease to 697,000 Annual Rate in June
by Calculated Risk on 7/26/2023 10:08:00 AM
The Census Bureau reports New Home Sales in June were at a seasonally adjusted annual rate (SAAR) of 697 thousand.
The previous three months were revised down.
Sales of new single‐family houses in June 2023 were at a seasonally adjusted annual rate of 697,000, according to estimates released jointly today by the U.S. Census Bureau and the Department of Housing and Urban Development. This is 2.5 percent below the revised May rate of 715,000, but is 23.8 percent above the June 2022 estimate of 563,000.
emphasis added
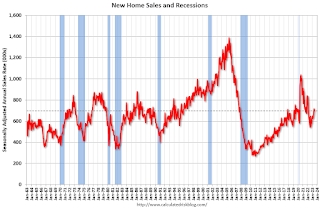 Click on graph for larger image.
The first graph shows New Home Sales vs. recessions since 1963. The dashed line is the current sales rate.
New home sales are at pre-pandemic levels.
The second graph shows New Home Months of Supply.
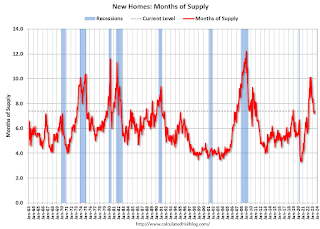 The months of supply increased in June to 7.4 months from 7.2 months in May.
 The all-time record high was 12.2 months of supply in January 2009. The all-time record low was 3.3 months in August 2020.
This is above the top of the normal range (about 4 to 6 months of supply is normal).
"The seasonally‐adjusted estimate of new houses for sale at the end of June was 432,000. This represents a supply of 7.4 months at the current sales rate."Sales were below expectations of 722 thousand SAAR, and sales for the three previous months were revised down. I'll have more later today.
MBA: Mortgage Applications Decreased in Weekly Survey
by Calculated Risk on 7/26/2023 07:00:00 AM
From the MBA: Mortgage Applications Decrease in Latest MBA Weekly Survey
Mortgage applications decreased 1.8 percent from one week earlier, according to data from the Mortgage Bankers Association’s (MBA) Weekly Mortgage Applications Survey for the week ending July 21, 2023.
The Market Composite Index, a measure of mortgage loan application volume, decreased 1.8 percent on a seasonally adjusted basis from one week earlier. On an unadjusted basis, the Index 1.5 percent compared with the previous week. The Refinance Index decreased 0.4 percent from the previous week and was 30 percent lower than the same week one year ago. The seasonally adjusted Purchase Index decreased 3 percent from one week earlier. The unadjusted Purchase Index decreased 2 percent compared with the previous week and was 23 percent lower than the same week one year ago.
“Mortgage rates were essentially flat last week but remained high, with the 30-year fixed staying at 6.87 percent and contributing to a pullback in mortgage applications,” said Joel Kan, MBA’s Vice President and Deputy Chief Economist. “The 2.5 percent decline in purchase activity, partly driven by a 10 percent decrease in FHA applications, pushed the purchase index to its lowest level in over a month. The decrease in FHA purchase applications contributed to an increase in the overall average purchase loan size to $432,700, its highest level since the end of this May. Refinance applications remained lackluster, running 30 percent behind year-ago levels. Many borrowers remain on the sidelines given current rates and persistent affordability challenges.”
...
The average contract interest rate for 30-year fixed-rate mortgages with conforming loan balances ($726,200 or less) remained unchanged at 6.87 percent, with points decreasing to 0.65 from 0.66 (including the origination fee) for 80 percent loan-to-value ratio (LTV) loans. The effective rate decreased from last week.
emphasis added
 Click on graph for larger image.
The first graph shows the MBA mortgage purchase index.
According to the MBA, purchase activity is down 23% year-over-year unadjusted.

Tuesday, July 25, 2023
Wednesday: New Home Sales, FOMC Statement
by Calculated Risk on 7/25/2023 08:55:00 PM

Wednesday:
• At 7:00 AM ET, The Mortgage Bankers Association (MBA) will release the results for the mortgage purchase applications index.
• At 10:00 AM, New Home Sales for June from the Census Bureau. The consensus is for 722 thousand SAAR, down from 763 thousand in May.
• At 2:00 PM, FOMC Meeting Announcement. The FOMC is expected to raise rates 25 bps, increasing the target range for the federal funds rate to 5‑1/4 to 5-1/2 percent.
• At 2:30 PM, Fed Chair Jerome Powell holds a press briefing following the FOMC announcement.
July Vehicle Sales Forecast: 15.8 million SAAR, Up Sharply YoY
by Calculated Risk on 7/25/2023 06:07:00 PM
From WardsAuto: July U.S. Light-Vehicle Sales Tracking to 15.8-Million SAAR; Q3 Volume Forecast for 17% Increase (pay content). Brief excerpt:
The initial outlook for Q3 is a 15.5 million-unit SAAR, a slight decline from Q2’s 15.6 million but above Q3-2022’s 13.3 million. However, as with July due to its atypical fifth weekend, there is upside to Q3, as well as the rest of the year, though that depends on continued steadiness in the economy, no major geopolitical disruptions and the impact from possible labor walkouts.
emphasis added
 Click on graph for larger image.
This graph shows actual sales from the BEA (Blue), and Wards forecast for July (Red).
The Wards forecast of 15.8 million SAAR, would be up 0.7% from last month, and up 18.7% from a year ago.
Comments on May Case-Shiller and FHFA House Prices
by Calculated Risk on 7/25/2023 09:47:00 AM
Today, in the Calculated Risk Real Estate Newsletter: Case-Shiller: National House Price Index Decreased 0.5% year-over-year in May
Excerpt:
The recent increase in mortgage rates to near 7% will not impact the Case-Shiller index until reports are released in the Fall.
...
Here is a comparison of year-over-year change in median house prices from the NAR and the year-over-year change in the Case-Shiller index. Median prices are distorted by the mix and repeat sales indexes like Case-Shiller and FHFA are probably better for measuring prices. However, in general, the Case-Shiller index follows the median price.
The median price was down 0.9% year-over-year in June, and, as expected, the Case-Shiller National Index was down 0.5% year-over-year in the May report.
Note: I’ll have more on real prices, price-to-rent and affordability later this week.
Seasonally adjusted house prices have increased over the last four months, and the big question is “Will house prices decline further later this year?”
Case-Shiller: National House Price Index Decreased 0.5% year-over-year in May
by Calculated Risk on 7/25/2023 09:11:00 AM
S&P/Case-Shiller released the monthly Home Price Indices for May ("May" is a 3-month average of March, April and May closing prices).
This release includes prices for 20 individual cities, two composite indices (for 10 cities and 20 cities) and the monthly National index.
From S&P S&P CoreLogic Case-Shiller Index Repeats Gains in May
The S&P CoreLogic Case-Shiller U.S. National Home Price NSA Index, covering all nine U.S. census divisions, reported a -0.5% annual decrease in May, down from a loss of -0.1% in the previous month. The 10-City Composite showed a decrease of -1.0%, which is a tick up from the -1.1% decrease in the previous month. The 20-City Composite posted a -1.7% year-over-year loss, same as in the previous month.
...
Before seasonal adjustment, the U.S. National Index posted a 1.2% month-over-month increase in May, while the 10-City and 20-City Composites both posted increases of 1.5%.
After seasonal adjustment, the U.S. National Index posted a month-over-month increase of 0.7%, while the 10-City Composite gained 1.1% and 20-City Composites posted an increase of 1.0%.
“The rally in U.S. home prices continued in May 2023,” says Craig J. Lazzara, Managing Director at S&P DJI. “Our National Composite rose by 1.2% in May, and now stands only 1.0% below its June 2022 peak. The 10- and 20-City Composites also rose in May, in both cases by 1.5%.
“The ongoing recovery in home prices is broadly based. Before seasonal adjustment, prices rose in all 20 cities in May (as they had also done in March and April). Seasonally adjusted data showed rising prices in 19 cities in May, repeating April’s performance. (The outlier is Phoenix, down 0.1% in both months.) On a trailing 12-month basis, the National Composite is 0.5% below its May 2022 level, with the 10- and 20-City Composites also negative on a year-over-year basis.
“Regional differences continue to be striking. This month’s league table shows the Revenge of the Rust Belt, as Chicago (+4.6%), Cleveland (+3.9%), and New York (+3.5%) were the top performers.
emphasis added
 Click on graph for larger image.
 The first graph shows the nominal seasonally adjusted Composite 10, Composite 20 and National indices (the Composite 20 was started in January 2000).
The Composite 10 index is up 1.1% in May (SA) and down 1.6% from the recent peak in June 2022.
The Composite 20 index is up 1.0% (SA) in May and down 2.3% from the recent peak in June 2022.
The National index is up 0.7% (SA) in May and is down 1.0% from the peak in June 2022.
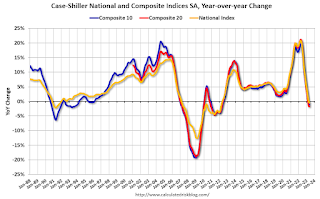 The second graph shows the year-over-year change in all three indices.
The Composite 10 SA is down 1.1% year-over-year. The Composite 20 SA is down 1.8% year-over-year.
The National index SA is down 0.5% year-over-year.
Annual price changes were at expectations. I'll have more later.
Monday, July 24, 2023
Tuesday: Case-Shiller House Prices
by Calculated Risk on 7/24/2023 07:22:00 PM
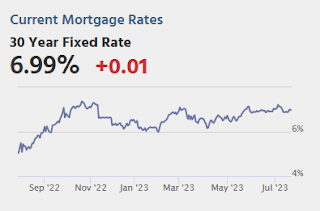
It was a fairly uneventful day for mortgage rates for the average lender--at least until the very end of the business day. Mortgage lenders prefer to set rates once a day, in the morning. Because rates are ultimately determined by bond prices, if bonds move enough during the day, lenders can "reprice" to follow the market.Tuesday:
In today's case, things had deteriorated enough by the last hour that several lenders repriced for the worse. This didn't amount to a big change in rates as far as the average mortgage borrower would be concerned, but it does leave the average lender in line with the highest rates in nearly 2 weeks. [30 year fixed 6.99%]
emphasis added
• At 9:00 AM ET, S&P/Case-Shiller House Price Index for May. The consensus is for a 1.9% year-over-year decrease in the Comp 20 index for May.
• At 9:00 AM, FHFA House Price Index for May. This was originally a GSE only repeat sales, however there is also an expanded index.
• At 10:00 AM, Richmond Fed Survey of Manufacturing Activity for July.


