by Calculated Risk on 7/27/2023 08:47:00 PM
Thursday, July 27, 2023
Friday: Personal Income and Outlays

Friday:
• At 8:30 AM ET, Personal Income and Outlays, June 2022. The consensus is for a 0.4% increase in personal income, and for a 0.4% increase in personal spending. And for the Core PCE price index to increase 0.2%. PCE prices are expected to be up 3.1% YoY, and core PCE prices up 4.2% YoY.
• At 10:00 AM, University of Michigan's Consumer sentiment index (Final for July). The consensus is for a reading of 72.6.
Realtor.com Reports Weekly Active Inventory Down 8% YoY; New Listings Down 18% YoY
by Calculated Risk on 7/27/2023 03:46:00 PM
Realtor.com has monthly and weekly data on the existing home market. Here is their weekly report from Danielle Hale: Weekly Housing Trends View — Data Week Ending July 22, 2023
• Active inventory declined, with for-sale homes lagging behind year ago levels by 8%. This week marks a 5th consecutive annual decline in the number of homes actively available for sale.
• New listings–a measure of sellers putting homes up for sale–were down again this week, by 18% from one year ago. The number of newly listed homes has been lower than the same time the previous year for the past 55 weeks. The size of the gap has been large and fairly consistent over the past year, but as we pass the period in 2022 when new listings slowed sharply, we may see declines wane.
 Here is a graph of the year-over-year change in inventory according to realtor.com.
 Inventory was down 8.1% year-over-year - this was the fifth consecutive week with a YoY decrease following 58 consecutive weeks with a YoY increase in inventory.
Fannie and Freddie: Single-Family Mortgage Delinquency Rate Declined, Multi-Family Increased in June
by Calculated Risk on 7/27/2023 11:56:00 AM
Today, in the Calculated Risk Real Estate Newsletter: Fannie and Freddie: Single-Family Mortgage Delinquency Rate Declined, Multi-Family Increased in June
Brief excerpt:
I’ve argued that there would not be a huge wave of single-family foreclosures this cycle since lending standards have been solid and most homeowners have substantial equity. That means we will not see cascading price declines like following the housing bubble. This is a high confidence prediction and is supported by the following data.You can subscribe at https://calculatedrisk.substack.com/.
However, there is some concern about some multi-family properties.
...
Freddie Mac reports that multi-family delinquencies increased to 0.21% in June, up from 0.07% in June 2022.
This graph shows the Freddie multi-family serious delinquency rate since 2012. Rates were still high in 2012 following the housing bust and financial crisis.
The multi-family rate increased following the pandemic and has increased recently as rent growth has slowed, vacancy rates have increased, lending has tightened, and interest rates have increased sharply. This will be something to watch as rents soften.
NAR: Pending Home Sales Up 0.3% in June; Down 15.6% Year-over-year
by Calculated Risk on 7/27/2023 10:03:00 AM
From the NAR: Pending Home Sales Rose 0.3% in June, First Increase in Three Months
Pending home sales registered a modest increase of 0.3% in June from the previous month – the first increase since February – according to the National Association of REALTORS®. The South and West posted monthly losses, while sales in the Northeast and Midwest grew. All four U.S. regions saw year-over-year declines in transactions.This is close to expectations of a 0.1% increase for this index. Note: Contract signings usually lead sales by about 45 to 60 days, so this would usually be for closed sales in July and August.
"The recovery has not taken place, but the housing recession is over," said NAR Chief Economist Lawrence Yun, "The presence of multiple offers implies that housing demand is not being satisfied due to lack of supply. Homebuilders are ramping up production and hiring workers."
The Pending Home Sales Index (PHSI)* – a forward-looking indicator of home sales based on contract signings – rose 0.3% to 76.8 in May. Year over year, pending transactions fell by 15.6%. An index of 100 is equal to the level of contract activity in 2001.
...
The Northeast PHSI ascended 0.6% from last month to 67.1, a decrease of 16.7% from June 2022. The Midwest index jumped 4.3% to 77.6 in June, down 17.1% from one year ago.
The South PHSI receded 1.4% to 93.3 in June, lessening 14.3% from the prior year. The West index fell 1.0% in June to 57.7, dipping 15.5% from May 2022.
emphasis added
Weekly Initial Unemployment Claims Decrease to 221,000
by Calculated Risk on 7/27/2023 08:37:00 AM
The DOL reported:
In the week ending July 22, the advance figure for seasonally adjusted initial claims was 221,000, a decrease of 7,000 from the previous week's unrevised level of 228,000. The 4-week moving average was 233,750, a decrease of 3,750 from the previous week's unrevised average of 237,500.The following graph shows the 4-week moving average of weekly claims since 1971.
emphasis added
 Click on graph for larger image.
The dashed line on the graph is the current 4-week average. The four-week average of weekly unemployment claims decreased to 233,750.
The previous week was unrevised.
Weekly claims were below the consensus forecast.
BEA: Real GDP increased at 2.4% Annualized Rate in Q2
by Calculated Risk on 7/27/2023 08:34:00 AM
From the BEA: Gross Domestic Product, Second Quarter 2023 (Advance Estimate)
Real gross domestic product (GDP) increased at an annual rate of 2.4 percent in the second quarter of 2023, according to the "advance" estimate released by the Bureau of Economic Analysis. In the first quarter, real GDP increased 2.0 percent.PCE increased at a 1.6% annual rate, and residential investment decreased at a 4.2% rate. The advance Q2 GDP report, with 2.4% annualized increase, was above expectations.
The increase in real GDP reflected increases in consumer spending, nonresidential fixed investment, state and local government spending, private inventory investment, and federal government spending that were partly offset by decreases in exports and residential fixed investment. Imports, which are a subtraction in the calculation of GDP, decreased.
The increase in consumer spending reflected increases in both services and goods. Within services, the leading contributors to the increase were housing and utilities, health care, financial services and insurance, and transportation services. Within goods, the increase was led by recreational goods and vehicles as well as gasoline and other energy goods. The increase in nonresidential fixed investment reflected increases in equipment, structures, and intellectual property products. The increase in state and local spending reflected increases in compensation of state and local government employees and gross investment in structures. The increase in private inventory investment reflected increases in both farm and nonfarm inventories.
Compared to the first quarter, the acceleration in GDP in the second quarter primarily reflected an upturn in private inventory investment and an acceleration in nonresidential fixed investment. These movements were partly offset by a downturn in exports, and decelerations in consumer spending, federal government spending, and state and local government spending. Imports turned down.
emphasis added
Wednesday, July 26, 2023
Thursday: GDP, Unemployment Claims, Durable Goods, Pending Home Sales
by Calculated Risk on 7/26/2023 08:44:00 PM

Thursday:
• At 8:30 AM ET, The initial weekly unemployment claims report will be released. The consensus is for 240 thousand initial claims, up from 228 thousand last week.
• Also at 8:30 AM, Gross Domestic Product, 2nd quarter (advance estimate), and annual update. The consensus is that real GDP increased 1.8% annualized in Q2, down from 2.0% in Q1.
• Also at 8:30 AM, Durable Goods Orders for June from the Census Bureau. The consensus is for a 1.0% increase in durable goods orders.
• At 10:00 AM, Pending Home Sales Index for June. The consensus is for a 0.1% increase in the index.
• At 11:00 AM, Kansas City Fed Survey of Manufacturing Activity for July.
FOMC Statement: Raise Rates 25 bp
by Calculated Risk on 7/26/2023 02:00:00 PM
Fed Chair Powell press conference video here or on YouTube here, starting at 2:30 PM ET.
FOMC Statement:
Recent indicators suggest that economic activity has been expanding at a moderate pace. Job gains have been robust in recent months, and the unemployment rate has remained low. Inflation remains elevated.
The U.S. banking system is sound and resilient. Tighter credit conditions for households and businesses are likely to weigh on economic activity, hiring, and inflation. The extent of these effects remains uncertain. The Committee remains highly attentive to inflation risks.
The Committee seeks to achieve maximum employment and inflation at the rate of 2 percent over the longer run. In support of these goals, the Committee decided to raise the target range for the federal funds rate to 5-1/4 to 5-1/2 percent. The Committee will continue to assess additional information and its implications for monetary policy. In determining the extent of additional policy firming that may be appropriate to return inflation to 2 percent over time, the Committee will take into account the cumulative tightening of monetary policy, the lags with which monetary policy affects economic activity and inflation, and economic and financial developments. In addition, the Committee will continue reducing its holdings of Treasury securities and agency debt and agency mortgage-backed securities, as described in its previously announced plans. The Committee is strongly committed to returning inflation to its 2 percent objective.
In assessing the appropriate stance of monetary policy, the Committee will continue to monitor the implications of incoming information for the economic outlook. The Committee would be prepared to adjust the stance of monetary policy as appropriate if risks emerge that could impede the attainment of the Committee's goals. The Committee's assessments will take into account a wide range of information, including readings on labor market conditions, inflation pressures and inflation expectations, and financial and international developments.
Voting for the monetary policy action were Jerome H. Powell, Chair; John C. Williams, Vice Chair; Michael S. Barr; Michelle W. Bowman; Lisa D. Cook; Austan D. Goolsbee; Patrick Harker; Philip N. Jefferson; Neel Kashkari; Lorie K. Logan; and Christopher J. Waller.
emphasis added
New Home Sales decrease to 697,000 Annual Rate in June; Median New Home Price is Down 16.4% from the Peak
by Calculated Risk on 7/26/2023 11:00:00 AM
Today, in the Calculated Risk Real Estate Newsletter: New Home Sales decrease to 697,000 Annual Rate in June
Brief excerpt:
And on prices, from the Census Bureau:You can subscribe at https://calculatedrisk.substack.com/.The median sales price of new houses sold in June 2023 was $415,400. The average sales price was $494,700.The following graph shows the median and average new home prices. The average price in June 2023 was $494,700 up 5% year-over-year. The median price was $415,400 down 4% year-over-year. Both the median and the average are impacted by the mix of homes sold.
The median price is down 16.4% from the peak in 2022, and the average prices is down 13.0% from the peak.
New Home Sales decrease to 697,000 Annual Rate in June
by Calculated Risk on 7/26/2023 10:08:00 AM
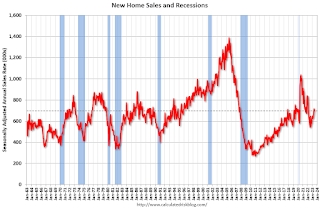
The Census Bureau reports New Home Sales in June were at a seasonally adjusted annual rate (SAAR) of 697 thousand.
The previous three months were revised down.
Sales of new single‐family houses in June 2023 were at a seasonally adjusted annual rate of 697,000, according to estimates released jointly today by the U.S. Census Bureau and the Department of Housing and Urban Development. This is 2.5 percent below the revised May rate of 715,000, but is 23.8 percent above the June 2022 estimate of 563,000.
emphasis added
 Click on graph for larger image.
The first graph shows New Home Sales vs. recessions since 1963. The dashed line is the current sales rate.
New home sales are at pre-pandemic levels.
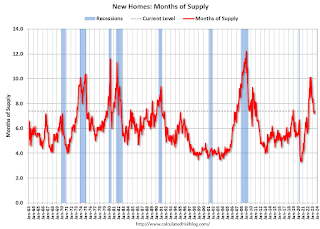
The second graph shows New Home Months of Supply.
 The months of supply increased in June to 7.4 months from 7.2 months in May.
 The all-time record high was 12.2 months of supply in January 2009. The all-time record low was 3.3 months in August 2020.
This is above the top of the normal range (about 4 to 6 months of supply is normal).
"The seasonally‐adjusted estimate of new houses for sale at the end of June was 432,000. This represents a supply of 7.4 months at the current sales rate."Sales were below expectations of 722 thousand SAAR, and sales for the three previous months were revised down. I'll have more later today.


