by Calculated Risk on 8/01/2023 10:22:00 AM
Tuesday, August 01, 2023
Construction Spending Increased 0.5% in June
From the Census Bureau reported that overall construction spending increased:
Construction spending during June 2023 was estimated at a seasonally adjusted annual rate of $1,938.4 billion, 0.5 percent above the revised May estimate of $1,929.6 billion. The June figure is 3.5 percent above the June 2022 estimate of $1,873.2 billion.Both private and public spending increased:
emphasis added
Spending on private construction was at a seasonally adjusted annual rate of $1,516.9 billion, 0.5 percent above the revised May estimate of $1,509.4 billion. ...
In June, the estimated seasonally adjusted annual rate of public construction spending was $421.4 billion, 0.3 percent above the revised May estimate of $420.2 billion.
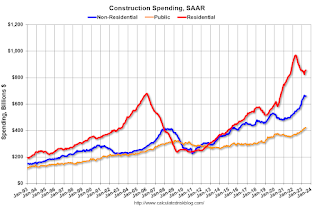
 Click on graph for larger image.
This graph shows private residential and nonresidential construction spending, and public spending, since 1993. Note: nominal dollars, not inflation adjusted.
Residential (red) spending is 11.7% below the recent peak.
Non-residential (blue) spending is close to the peak in April 2023.
Public construction spending is at a new peak.
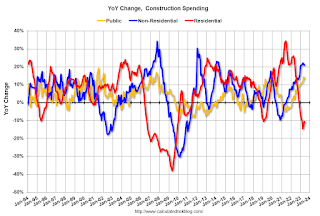
 The second graph shows the year-over-year change in construction spending.
On a year-over-year basis, private residential construction spending is down 10.4%. Non-residential spending is up 20.9% year-over-year. Public spending is up 13.6% year-over-year.
BLS: Job Openings Decreased Slightly to 9.6 million in June
by Calculated Risk on 8/01/2023 10:09:00 AM
From the BLS: Job Openings and Labor Turnover Summary
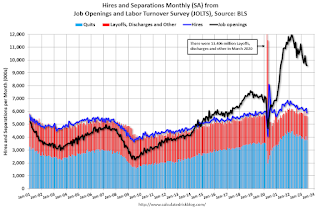
The number of job openings was little changed at 9.6 million on the last business day of June, the U.S. Bureau of Labor Statistics reported today. Over the month, the number of hires and total separations decreased to 5.9 million and 5.6 million, respectively. Within separations, quits (3.8 million) decreased, while layoffs and discharges (1.5 million) changed little.The following graph shows job openings (black line), hires (dark blue), Layoff, Discharges and other (red column), and Quits (light blue column) from the JOLTS.
emphasis added
This series started in December 2000.
Note: The difference between JOLTS hires and separations is similar to the CES (payroll survey) net jobs headline numbers. This report is for June; the employment report this Friday will be for July.
 Click on graph for larger image.
Note that hires (dark blue) and total separations (red and light blue columns stacked) are usually pretty close each month. This is a measure of labor market turnover. When the blue line is above the two stacked columns, the economy is adding net jobs - when it is below the columns, the economy is losing jobs.
The spike in layoffs and discharges in March 2020 is labeled, but off the chart to better show the usual data.
Jobs openings decreased in June to 9.58 million from 9.62 million in May.
The number of job openings (black) were down 13% year-over-year.
Quits were down 9% year-over-year. These are voluntary separations. (See light blue columns at bottom of graph for trend for "quits").
ISM® Manufacturing index Increased to 46.4% in July
by Calculated Risk on 8/01/2023 10:00:00 AM
(Posted with permission). The ISM manufacturing index indicated contraction. The PMI® was at 46.4% in July, up from 46.0% in June. The employment index was at 44.4%, down from 48.1% the previous month, and the new orders index was at 47.3%, up from 45.6%.
From ISM: Manufacturing PMI® at 46.4%
July 2023 Manufacturing ISM® Report On Business®
Economic activity in the manufacturing sector contracted in July for the ninth consecutive month following a 28-month period of growth, say the nation's supply executives in the latest Manufacturing ISM® Report On Business®.This suggests manufacturing contracted in July. This was close to the consensus forecast.
The report was issued today by Timothy R. Fiore, CPSM, C.P.M., Chair of the Institute for Supply Management® (ISM®) Manufacturing Business Survey Committee:
“The July Manufacturing PMI® registered 46.4 percent, 0.4 percentage point higher than the 46 percent recorded in June. Regarding the overall economy, this figure indicates an eighth month of contraction after a 30-month period of expansion. The New Orders Index remained in contraction territory at 47.3 percent, 1.7 percentage points higher than the figure of 45.6 percent recorded in June. The Production Index reading of 48.3 percent is a 1.6-percentage point increase compared to June’s figure of 46.7 percent. The Prices Index registered 42.6 percent, up 0.8 percentage point compared to the June figure of 41.8 percent. The Backlog of Orders Index registered 42.8 percent, 4.1 percentage points higher than the June reading of 38.7 percent. The Employment Index dropped further into contraction, registering 44.4 percent, down 3.7 percentage points from June’s reading of 48.1 percent.
emphasis added
CoreLogic: US Annual Home Price Growth Inches Up in June
by Calculated Risk on 8/01/2023 08:00:00 AM
Notes: This CoreLogic House Price Index report is for June. The recent Case-Shiller index release was for May. The CoreLogic HPI is a three-month weighted average and is not seasonally adjusted (NSA).
From CoreLogic: US Annual Home Price Growth Inches Up in June
• U.S. home prices continued to reach new highs in June and are 41% above pre-pandemic levels.This index was up 1.5% YoY in May.
• Annual U.S. single-family home price growth was up by 1.6% in June after increasing by 1.5% in May, marking the 137th straight month of year-over-year gains and a pivot after 13 months of slowing.
• National home prices increased by 4.8% since the beginning of the year in June, marking the sixth consecutive month of gains.
• Ten states and one district posted year-over-year home price declines in June, with most of the losses again concentrated in the West. While the annual losses reflect last year’s declines, many West Coast markets are expected to see a strong rebound in prices over the next year.
• The strongest home price gains since the beginning of the year have been in the Northeast (New Hampshire, Connecticut, Rhode Island and New Jersey) and the Midwest (Missouri, Wisconsin and Ohio).
emphasis added
Monday, July 31, 2023
Tuesday: CoreLogic House Prices, Job Openings, ISM Mfg, Construction Spending, Vehicle Sales
by Calculated Risk on 7/31/2023 08:27:00 PM

As the new week begins, mortgage rates are almost perfectly in line with those seen on Friday afternoon. Putting that in context, last Thursday and Friday marked the highest rates in weeks although Friday was quite a bit better. In both cases and again today, the average lender is just over 7% for a top tier conventional 30yr fixed scenario. [30 year fixed 7.04%]Tuesday:
emphasis added
• At 8:00 AM ET, Corelogic House Price index for June
• At 10:00 AM, Job Openings and Labor Turnover Survey for June from the BLS.
• Also at 10:00 AM, ISM Manufacturing Index for July. The consensus is for the ISM to be at 46.5, up from 46.0 in June.
• Also at 10:00 AM, Construction Spending for June. The consensus is for no change in construction spending.
• All Day, Light vehicle sales for July from the BEA. The consensus is for light vehicle sales to be 15.5 million SAAR in July, down from 15.7 million in June (Seasonally Adjusted Annual Rate).
Freddie Mac House Price Index Increased in June to New High; Up 1.7% Year-over-year
by Calculated Risk on 7/31/2023 02:21:00 PM
Today, in the Calculated Risk Real Estate Newsletter: Freddie Mac House Price Index Increased in June to New High; Up 1.7% Year-over-year
A brief excerpt:
On a year-over-year basis, the National FMHPI was up 1.7% in June, from up 0.8% YoY in May. The YoY increase peaked at 19.2% in July 2021. ...There is much more in the article. You can subscribe at https://calculatedrisk.substack.com/
In June, 15 states and D.C. were below their previous peaks, Seasonally Adjusted. The largest seasonally adjusted declines from the recent peak were in Idaho (-7.7%), Nevada (-5.2%), D.C. (-4.9%), Arizona (-4.9%), Hawaii (-4.6%), Utah (-3.8%), Washington (-33%), and Oregon (-2.5%).
For cities (Core-based Statistical Areas, CBSA), here are the 30 cities with the largest declines from the peak, seasonally adjusted.
...
The FMHPI and the NAR median prices appear to be leading indicators for Case-Shiller. The Case-Shiller index was down 0.5% YoY in May. The FMHPI is suggesting the YoY change in the Case-Shiller index will likely by up soon.
The big question is “Will house prices decline further later this year?”
Fed SLOOS Survey: Banks reported Tighter Standards, Weaker Demand for All Loan Types
by Calculated Risk on 7/31/2023 02:13:00 PM
From the Federal Reserve: The July 2023 Senior Loan Officer Opinion Survey on Bank Lending Practices
The July 2023 Senior Loan Officer Opinion Survey on Bank Lending Practices (SLOOS) addressed changes in the standards and terms on, and demand for, bank loans to businesses and households over the past three months, which generally correspond to the second quarter of 2023.
Regarding loans to businesses, survey respondents reported, on balance, tighter standards and weaker demand for commercial and industrial (C&I) loans to firms of all sizes over the second quarter. Meanwhile, banks reported tighter standards and weaker demand for all commercial real estate (CRE) loan categories.
For loans to households, banks reported that lending standards tightened across all categories of residential real estate (RRE) loans, especially for RRE loans other than government-sponsored enterprise (GSE)-eligible and government loans. Meanwhile, demand weakened for all RRE loan categories. In addition, banks reported tighter standards and weaker demand for home equity lines of credit (HELOCs). Furthermore, standards tightened for all consumer loan categories; demand weakened for auto and other consumer loans, while it remained basically unchanged for credit card loans.
emphasis added
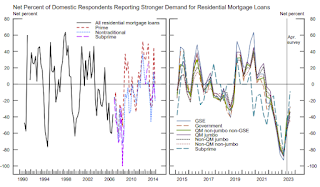
 Click on graph for larger image.
This graph on Residential Real Estate demand is from the Senior Loan Officer Survey Charts.
This shows that demand has declined.
Housing July 31st Weekly Update: Inventory increased 1.1% Week-over-week; Down 10.1% Year-over-year
by Calculated Risk on 7/31/2023 08:11:00 AM
 Click on graph for larger image.
This inventory graph is courtesy of Altos Research.

Sunday, July 30, 2023
Sunday Night Futures
by Calculated Risk on 7/30/2023 06:30:00 PM
Weekend:
• Schedule for Week of July 30, 2023
Monday:
• 9:45 AM ET, Chicago Purchasing Managers Index for July.
• 10:30 AM, Dallas Fed Survey of Manufacturing Activity for July.
• 2:00 PM, Senior Loan Officer Opinion Survey on Bank Lending Practices (SLOOS) for July.
From CNBC: Pre-Market Data and Bloomberg futures S&P 500 futures are up 6 and DOW futures are up 29 (fair value).
Oil prices were up over the last week with WTI futures at $80.58 per barrel and Brent at $84.99 per barrel. A year ago, WTI was at $101, and Brent was at $112 - so WTI oil prices are down about 20% year-over-year.
Here is a graph from Gasbuddy.com for nationwide gasoline prices. Nationally prices are at $3.71 per gallon. A year ago, prices were at $4.19 per gallon, so gasoline prices are down $0.48 per gallon year-over-year.
Q2 2023 Update: Unofficial Problem Bank list Increased to 47 Institutions
by Calculated Risk on 7/30/2023 08:21:00 AM
The Heartland Tri-State Bank was closed on Friday, but wasn't on the unofficial list.
The FDIC's official problem bank list is comprised of banks with a CAMELS rating of 4 or 5, and the list is not made public (just the number of banks and assets every quarter). Note: Bank CAMELS ratings are also not made public.
CAMELS is the FDIC rating system, and stands for Capital adequacy, Asset quality, Management, Earnings, Liquidity and Sensitivity to market risk. The scale is from 1 to 5, with 1 being the strongest.
As a substitute for the CAMELS ratings, surferdude808 is using publicly announced formal enforcement actions, and also media reports and company announcements that suggest to us an enforcement action is likely, to compile a list of possible problem banks in the public interest.
DISCLAIMER: This is an unofficial list, the information is from public sources only, and while deemed to be reliable is not guaranteed. No warranty or representation, expressed or implied, is made as to the accuracy of the information contained herein and same is subject to errors and omissions. This is not intended as investment advice. Please contact CR with any errors.
Here are the quarterly changes and a few comments from surferdude808:
Update on the Unofficial Problem Bank List through June 30, 2023. Since the last update at the end of March 2023, the list increased by one to 47 institutions after three additions and two removals. Assets increased by $5.7 billion to $55 billion, overcoming a $3.1 billion decrease from updated asset figures through March 31, 2023. A year ago, the list held 54 institutions with assets of $54.4 billion. Additions include Cross River Bank, Teaneck, NJ ($8.5 billion); The Idabel National Bank, Idabel, OK ($292 million); and Du Quoin State Bank, Du Quoin, IL ($137 million). Removals were United Trust Bank, Palos Heights, IL ($143 million) and Wabash Savings Bank, Mount Carmel, IL ($9.6 million).
With the conclusion of the second quarter, we bring an updated transition matrix to detail how banks are transitioning off the Unofficial Problem Bank List. Since we first published the Unofficial Problem Bank List on August 7, 2009 with 389 institutions, 1,784 institutions have appeared on a weekly or monthly list since then. Only 2.6 percent of the banks that have appeared on a list remain today as 1,745 institutions have transitioned through the list. Departure methods include 1,032 action terminations, 411 failures, 283 mergers, and 19 voluntary liquidations. Of the 389 institutions on the first published list, only 3 or less than 1.0 percent, still have a troubled designation more than ten years later. The 411 failures represent nearly 23 percent of the 1,792 institutions that have made an appearance on the list. This failure rate is well above the 10-12 percent rate frequently cited in media reports on the failure rate of banks on the FDIC's official list.
On May 31, 2023, the FDIC released first quarter results and provided an update on the Official Problem Bank List. While FDIC did not make a comment within its press release on the Official Problem Bank List, they provided aggregate totals of 43 institutions with assets of $58 billion.


