by Calculated Risk on 8/03/2023 08:33:00 AM
Thursday, August 03, 2023
Weekly Initial Unemployment Claims Increase to 227,000
The DOL reported:
In the week ending July 29, the advance figure for seasonally adjusted initial claims was 227,000, an increase of 6,000 from the previous week's unrevised level of 221,000. The 4-week moving average was 228,250, a decrease of 5,500 from the previous week's unrevised average of 233,750.The following graph shows the 4-week moving average of weekly claims since 1971.
emphasis added
 Click on graph for larger image.
The dashed line on the graph is the current 4-week average. The four-week average of weekly unemployment claims decreased to 228,250.
The previous week was unrevised.
Weekly claims were close to the consensus forecast.
Wednesday, August 02, 2023
Thursday: Unemployment Claims, ISM Services
by Calculated Risk on 8/02/2023 08:23:00 PM
Thursday:
• At 8:30 AM ET, The initial weekly unemployment claims report will be released. The consensus is for 228 thousand initial claims, up from 221 thousand last week.
• At 10:00 AM, the ISM Services Index for July. The consensus is for a reading of 53.1, down from 53.9.
HVS: Q2 2023 Homeownership and Vacancy Rates; Rental Vacancy Rates Increased YoY
by Calculated Risk on 8/02/2023 05:20:00 PM
The Census Bureau released the Residential Vacancies and Homeownership report for Q2 2023 today.
The results of this survey were significantly distorted by the pandemic in 2020.
This report is frequently mentioned by analysts and the media to track household formation, the homeownership rate, and the homeowner and rental vacancy rates. However, there are serious questions about the accuracy of this survey.
This survey might show the trend, but I wouldn't rely on the absolute numbers. Analysts probably shouldn't use the HVS to estimate the excess vacant supply or household formation, or rely on the homeownership rate, except as a guide to the trend.
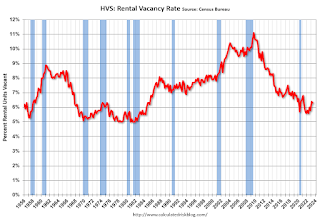
National vacancy rates in the second quarter 2023 were 6.3 percent for rental housing and 0.7 percent for homeowner housing. The rental vacancy rate was higher than the rate in the second quarter 2022 (5.6 percent) and not statistically different than the rate in the first quarter 2023 (6.4 percent).
The homeowner vacancy rate of 0.7 percent was lower than the rate in the second quarter 2022 (0.8 percent) and not statistically different than the rate in the first quarter 2023 (0.8 percent).
The homeownership rate of 65.9 percent was not statistically different from the rate in the second quarter 2022 (65.8 percent) and not statistically different from the rate in the first quarter 2023 (66.0 percent).
emphasis added
 Click on graph for larger image.
The HVS homeownership rate was declined slightly at 65.9% in Q2, from 66.0% in Q1.
The results in Q2 and Q3 2020 were distorted by the pandemic and should be ignored.
 The HVS homeowner vacancy was decreased to 0.7% in Q2 from 0.8% in Q1.
 Once again - this probably shows the general trend, but I wouldn't rely on the absolute numbers.
Heavy Truck Sales Hit New Record High; Up 18% Year-over-year in July
by Calculated Risk on 8/02/2023 01:02:00 PM
This graph shows heavy truck sales since 1967 using data from the BEA. The dashed line is the July 2023 seasonally adjusted annual sales rate (SAAR).
Heavy truck sales really collapsed during the great recession, falling to a low of 180 thousand SAAR in May 2009. Then heavy truck sales increased to a new record high of 570 thousand SAAR in April 2019.
 Click on graph for larger image.
Note: "Heavy trucks - trucks more than 14,000 pounds gross vehicle weight."
Heavy truck sales declined sharply at the beginning of the pandemic, falling to a low of 308 thousand SAAR in May 2020.
How Much will the Fannie & Freddie Conforming Loan Limit Change for 2024?
by Calculated Risk on 8/02/2023 10:19:00 AM
Today, in the Calculated Risk Real Estate Newsletter: How Much will the Fannie & Freddie Conforming Loan Limit Change for 2024?
A brief excerpt:
With house prices mostly unchanged over the last year, an interesting question is: How much will the Fannie & Freddie conforming loan limits (CLL) change for 2024? And how much will the FHA insured loan limits change?There is much more in the article. You can subscribe at https://calculatedrisk.substack.com/
First, there are different loan limits for various geographical areas. There are also different loan limits depending on the number of units (from 1 to 4 units). For example, currently the CLL is $726,200 for one-unit properties in low-cost areas. For high-cost areas like Los Angeles County, the CLL is $1,089,300 for one-unit properties (50% higher than the baseline CLL).
...
The CLL for each county is available at 2023 Conforming Loan Limits (excel file).
The limit is updated annually, and is adjusted using the FHFA’s quarterly national, seasonally adjusted, expanded-data index: Expanded-Data Indexes (Estimated using Enterprise, FHA, and Real Property County Recorder Data Licensed from DataQuick for sales below the annual loan limit ceiling). The adjustment is based on the House Price Index value in Q3 divided by Q3 in the prior year. The FHFA index is a repeat sales index, similar to Case-Shiller.
...
Currently we only have data for Q1 2023 for the quarterly index (up 5.9% from Q1 2022), and the monthly House Price Index was up 2.8% YoY through May 2023.
...
We need the house price data through September 2023 to calculate the conforming loan limit for 2024. This quarterly data will be released in late November.
ADP: Private Employment Increased 324,000 in July
by Calculated Risk on 8/02/2023 08:20:00 AM
Private sector employment increased by 324,000 jobs in July and annual pay was up 6.2 percent year-over-year, according to the July ADP® National Employment ReportTM produced by the ADP Research Institute® in collaboration with the Stanford Digital Economy Lab (“Stanford Lab”).This was above the consensus forecast of 185,000. The BLS report will be released Friday, and the consensus is for 184 thousand non-farm payroll jobs added in July.
...
“The economy is doing better than expected and a healthy labor market continues to support household spending,” said Nela Richardson, chief economist, ADP. “We continue to see a slowdown in pay growth without broad-based job loss.”
emphasis added
MBA: Mortgage Applications Decreased in Weekly Survey
by Calculated Risk on 8/02/2023 07:00:00 AM
From the MBA: Mortgage Applications Decrease in Latest MBA Weekly Survey
Mortgage applications decreased 3.0 percent from one week earlier, according to data from the Mortgage Bankers Association’s (MBA) Weekly Mortgage Applications Survey for the week ending July 28, 2023.
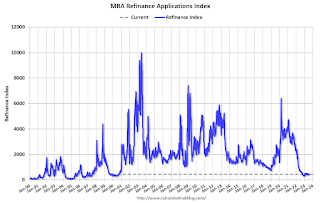
The Market Composite Index, a measure of mortgage loan application volume, decreased 3.0 percent on a seasonally adjusted basis from one week earlier. On an unadjusted basis, the Index decreased 3 percent compared with the previous week. The Refinance Index decreased 3 percent from the previous week and was 32 percent lower than the same week one year ago. The seasonally adjusted Purchase Index decreased 3 percent from one week earlier. The unadjusted Purchase Index decreased 3 percent compared with the previous week and was 26 percent lower than the same week one year ago.
“Mortgage rates edged higher last week, with the 30-year fixed mortgage rate’s increase to 6.93 percent and leading to another decline in overall applications,” said Joel Kan, MBA’s Vice President and Deputy Chief Economist. “The purchase index decreased for the third straight week to its lowest level since the beginning of June and remains 26 percent behind last year’s levels. The decline in purchase activity was driven mainly by weaker conventional purchase application volume, as limited housing inventory and rates still close to 7 percent are crimping affordability for many potential homebuyers. The refinance market continues to feel the impact of these higher rates, and applications trailed last year’s pace by over 30 percent with many homeowners not looking for refinance opportunities.”
...
The average contract interest rate for 30-year fixed-rate mortgages with conforming loan balances ($726,200 or less) increased to 6.93 percent from 6.87 percent, with points increasing to 0.68 from 0.65 (including the origination fee) for 80 percent loan-to-value ratio (LTV) loans.
emphasis added
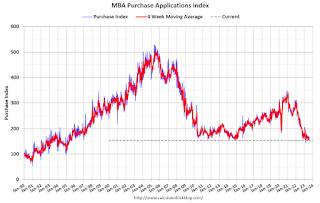 Click on graph for larger image.
The first graph shows the MBA mortgage purchase index.
According to the MBA, purchase activity is down 26% year-over-year unadjusted.
Tuesday, August 01, 2023
Wednesday: ADP Employment, Q2 Housing Vacancies and Homeownership
by Calculated Risk on 8/01/2023 09:02:00 PM
Wednesday:
• At 7:00 AM ET, The Mortgage Bankers Association (MBA) will release the results for the mortgage purchase applications index.
• At 8:15 AM: The ADP Employment Report for July. This report is for private payrolls only (no government). The consensus is for 185,000 payroll jobs added in July, down from 497,000 in June.
• At 10:00 AM, the Q2 2023 Housing Vacancies and Homeownership from the Census Bureau.
Vehicles Sales at 15.74 million SAAR in July; Up 18% YoY
by Calculated Risk on 8/01/2023 05:25:00 PM
Wards Auto released their estimate of light vehicle sales for July: U.S. Light-Vehicle Sales Post 11th Straight Increase in July (pay site).
Assuming no shocks to the economy, sales appear easily on their way to reaching the 15.4 million units forecast for the year. Battery-electric-vehicle deliveries increased 51% year-over-year, accounting for a record-high 7.5% of the market.
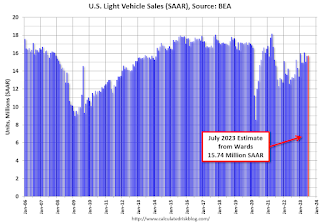 Click on graph for larger image.
This graph shows light vehicle sales since 2006 from the BEA (blue) and Wards Auto's estimate for July (red).
The impact of COVID-19 was significant, and April 2020 was the worst month. After April 2020, sales increased, and were close to sales in 2019 (the year before the pandemic). However, sales decreased in 2021 due to supply issues. The "supply chain bottom" was in September 2021.
 The second graph shows light vehicle sales since the BEA started keeping data in 1967.
 Sales in July were above the consensus forecast.
Asking Rents Negative Year-over-year
by Calculated Risk on 8/01/2023 11:15:00 AM
Today, in the Calculated Risk Real Estate Newsletter: Asking Rents Negative Year-over-year
A brief excerpt:
Tracking rents is important for understanding the dynamics of the housing market. For example, the sharp increase in rents helped me deduce that there was a surge in household formation in 2021 (See from September 2021: Household Formation Drives Housing Demand).There is much more in the article. You can subscribe at https://calculatedrisk.substack.com/
The surge in household formation has been confirmed (mostly due to work-from-home), and this also led to the supposition that household formation would slow sharply in 2023 (mostly confirmed) and that asking rents might decrease in 2023 on a year-over-year basis (now flat year-over-year).
...
Here is a graph of the year-over-year (YoY) change for these measures since January 2015. Most of these measures are through June 2023, except CoreLogic is through June and Apartment List is through July 2023.
...
The CoreLogic measure is up 3.4% YoY in May, down from 3.7% in April, and down from a peak of 13.9% in April 2022.
The Zillow measure is up 4.1% YoY in June, down from 4.9% YoY in May, and down from a peak of 16.5% YoY in March 2022.
The ApartmentList measure is down at 0.7% YoY as of July, down from unchanged in June, and down from a peak of 18.1% YoY November 2021.
...
With slow household formation, more supply coming on the market and a rising vacancy rate, rents will be under pressure all year.

